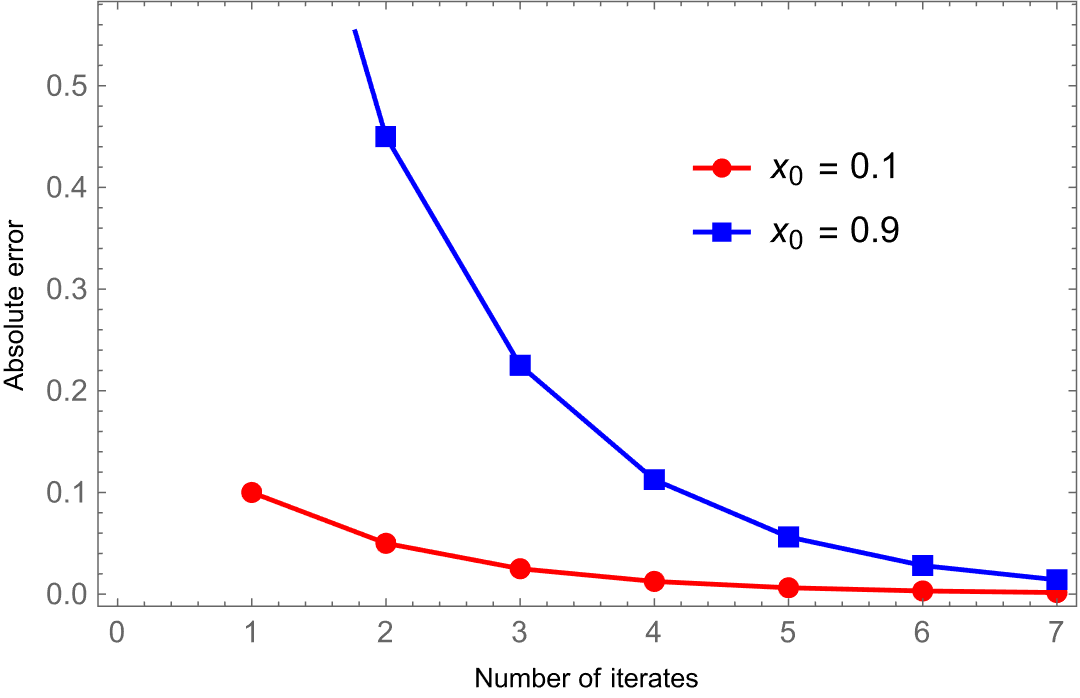
I have the following operator $T:[0,1]\rightarrow[0,1]$ by $Tx=\frac{x}{2}$. I use the following method for two different initial point $x_{0}\in[0,1]$ as $x_{n+1}=Tx_{n}$ $n=0,1,2,3,...$ I have set the following codes in mathemtica for $x_{0}=0.1$ and $x_{0}=0.9$ as
Clear[x, T, a, b, c]
T[x_] := T[x] = (x/2)
x[0] = 0.1;
x[n_] := x[n] = T[x[n - 1]]
NumberForm[a1 = {Table[x[i], {i, 0, 6}]}, 4]
The plot code is for this I used
plot1 = ListPlot[a1, Joined -> True, PlotStyle -> Red]
Now for the secod initial Point
Clear[x, T, a, b, c]
T[x_] := T[x] = (x/2)
x[0] = 0.1;
x[n_] := x[n] = T[x[n - 1]]
NumberForm[a1 = {Table[x[i], {i, 0, 6}]}, 4]
The plot code is for this I used
Clear[x, T, a, b, c]
[x_] := T[x] = (x/2)
x[0] = 0.9;
x[n_] := x[n] = T[x[n - 1]]
NumberForm[a2 = {Table[x[i], {i, 0, 6}]}, 4]
And plotting these vales as:
plot2 = ListPlot[a2, Joined -> True, PlotStyle -> Blue]
I have combined these two plots as:
Show[plot1, plot2, PlotRange -> Automatic, Frame -> {{True, True}, {True, True}},FrameLabel -> {Style["Number of iterates", Black, Small],Style["Absolute error", Black, Small]},Epilog->Inset[LineLegend[{Red, Blue, Cyan}, {"x0=0.1", "x0=0.9"}], {5,0.4}]]
I get the following attached graph  . But I need a graph and legend Plotmarker like https://i.sstatic.net/KWX9u.jpg this full post is at Show[List of plot] how to color them differently?


