I have several data files containing three columns x, y, clas, where x and y are the coordinates on the configuration plane, while clas is an integer indicating the final state of the initial condition. If we plot each initial condition with a different color, corresponding to the particular final state, then we can obtain an interesting color-coded diagram. In my case there are only five possible final states:
clas = -1 ---> The orbit is trapped chaotic (black).
clas = 0 ---> The orbit is non-escaping regular (cyan).
clas = 1 ---> The orbit escapes from channel #1 (green).
clas = 2 ---> The orbit escapes from channel #2 (red).
clas = 3 ---> The orbit escapes from channel #3 (blue).
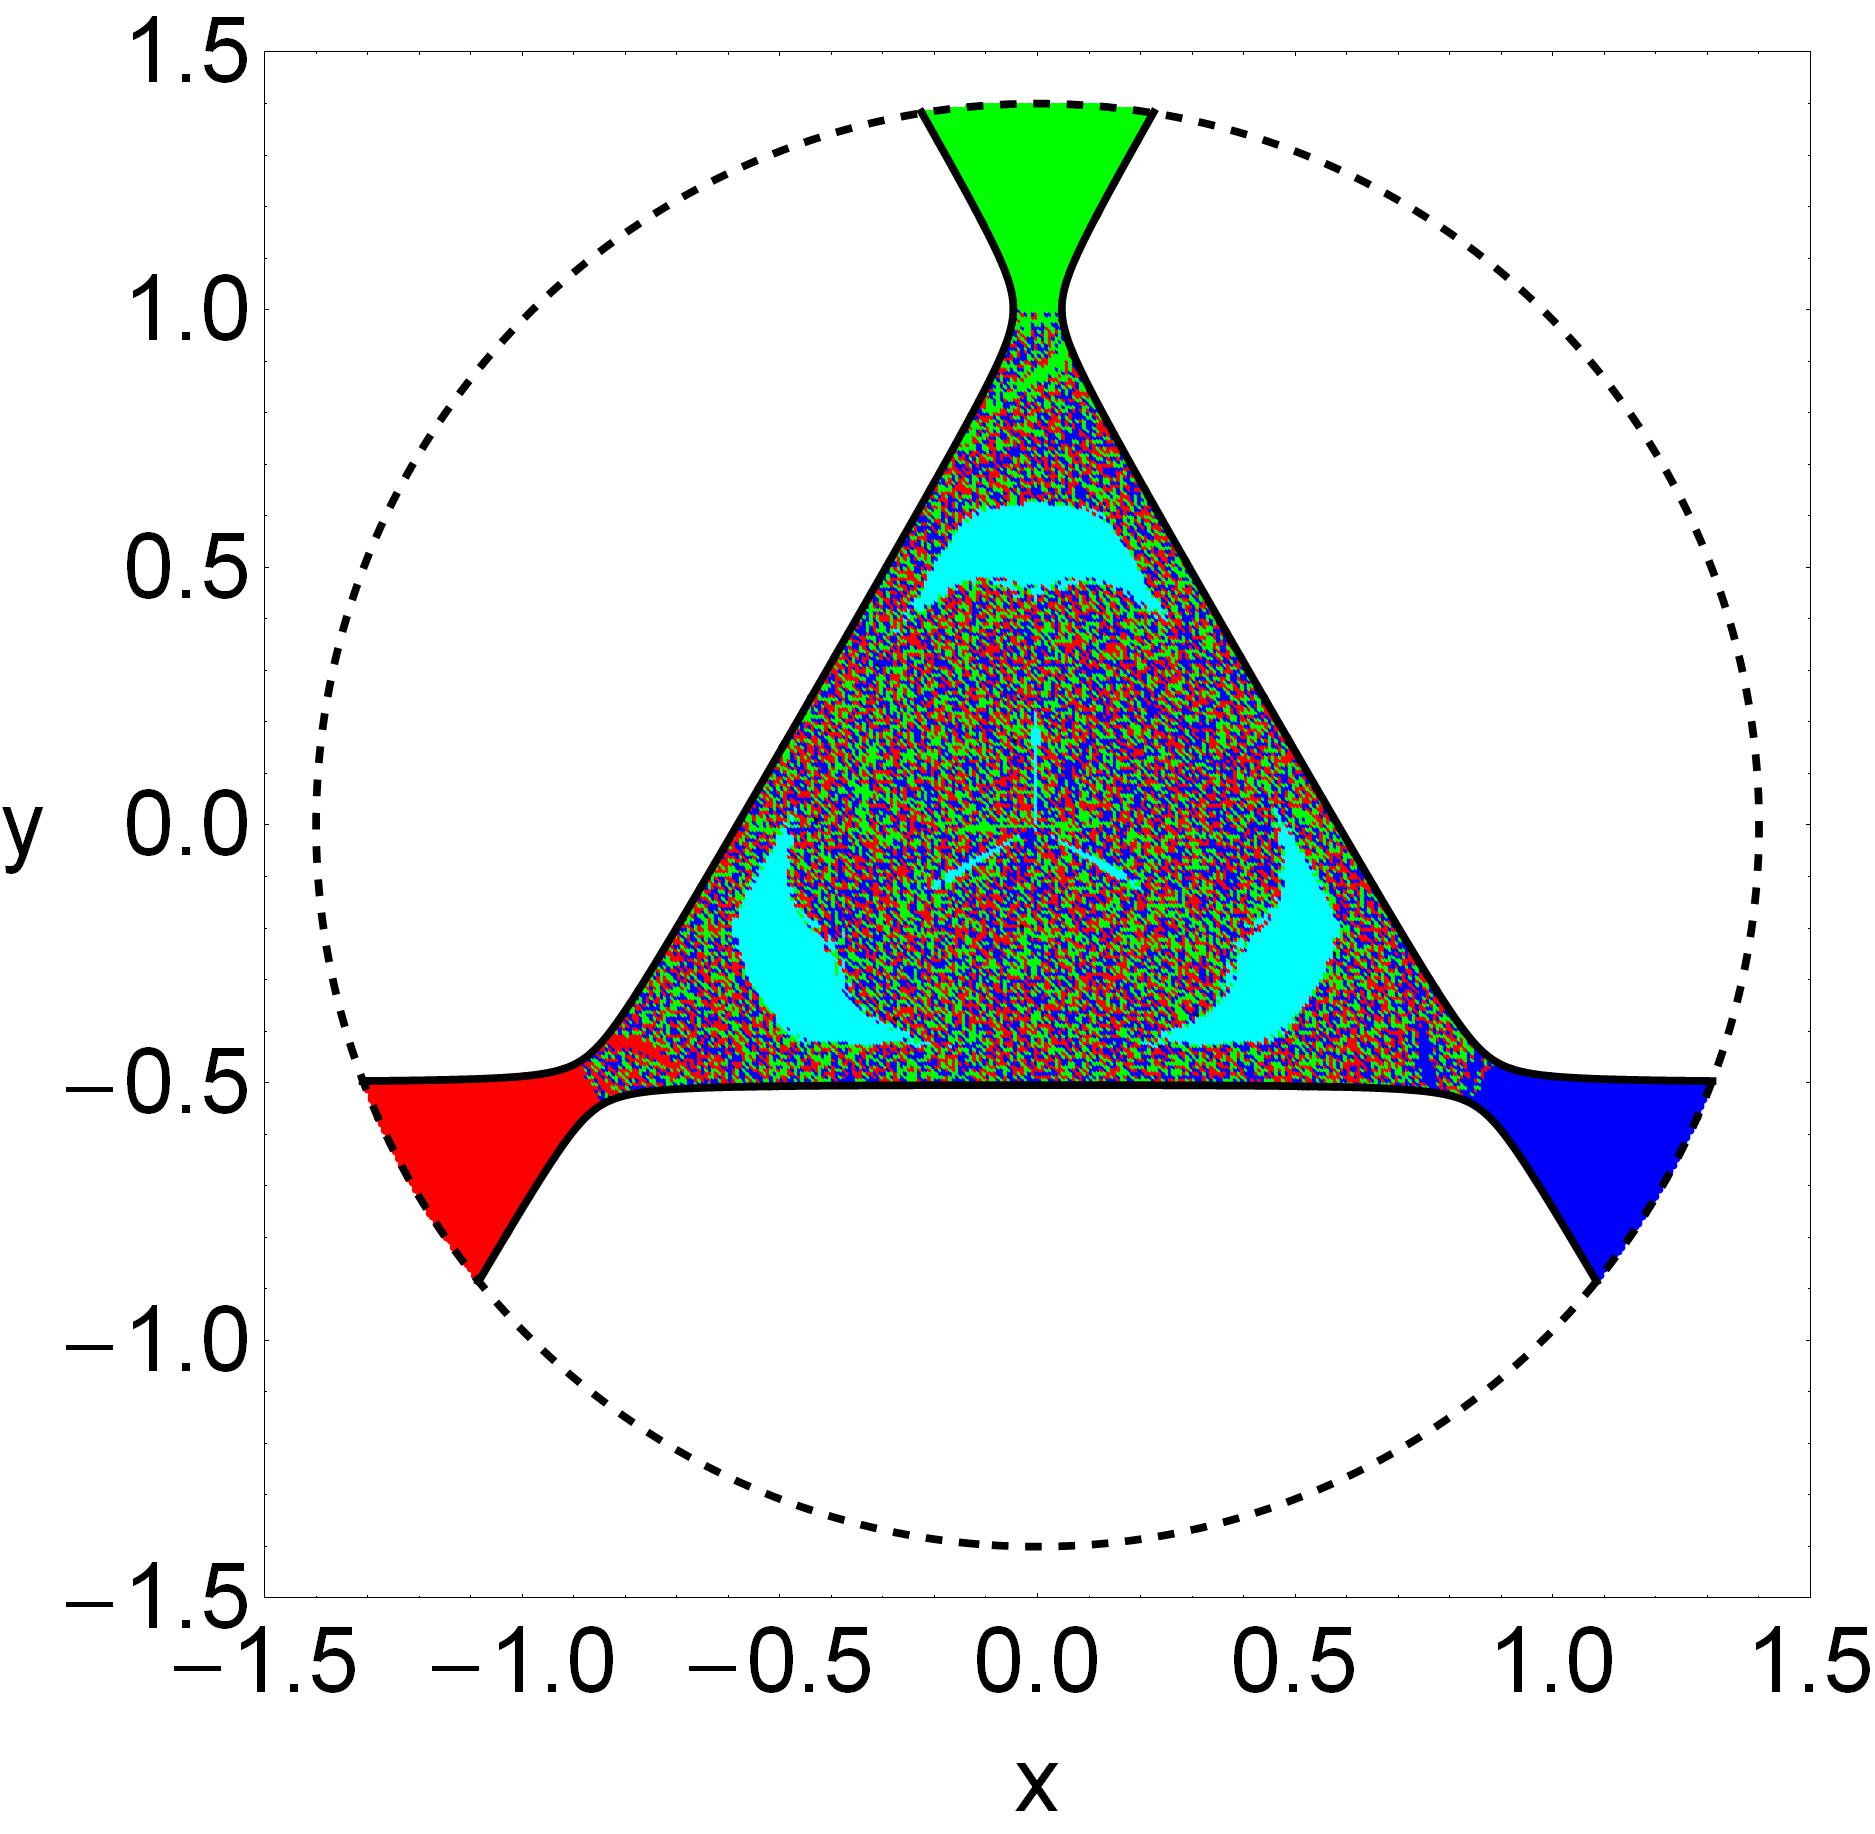
For this data file the corresponding color-coded diagram is the following
It is seen that in the central region there is a highly complicated (fractal/chaotic) mixture of escaping orbits.
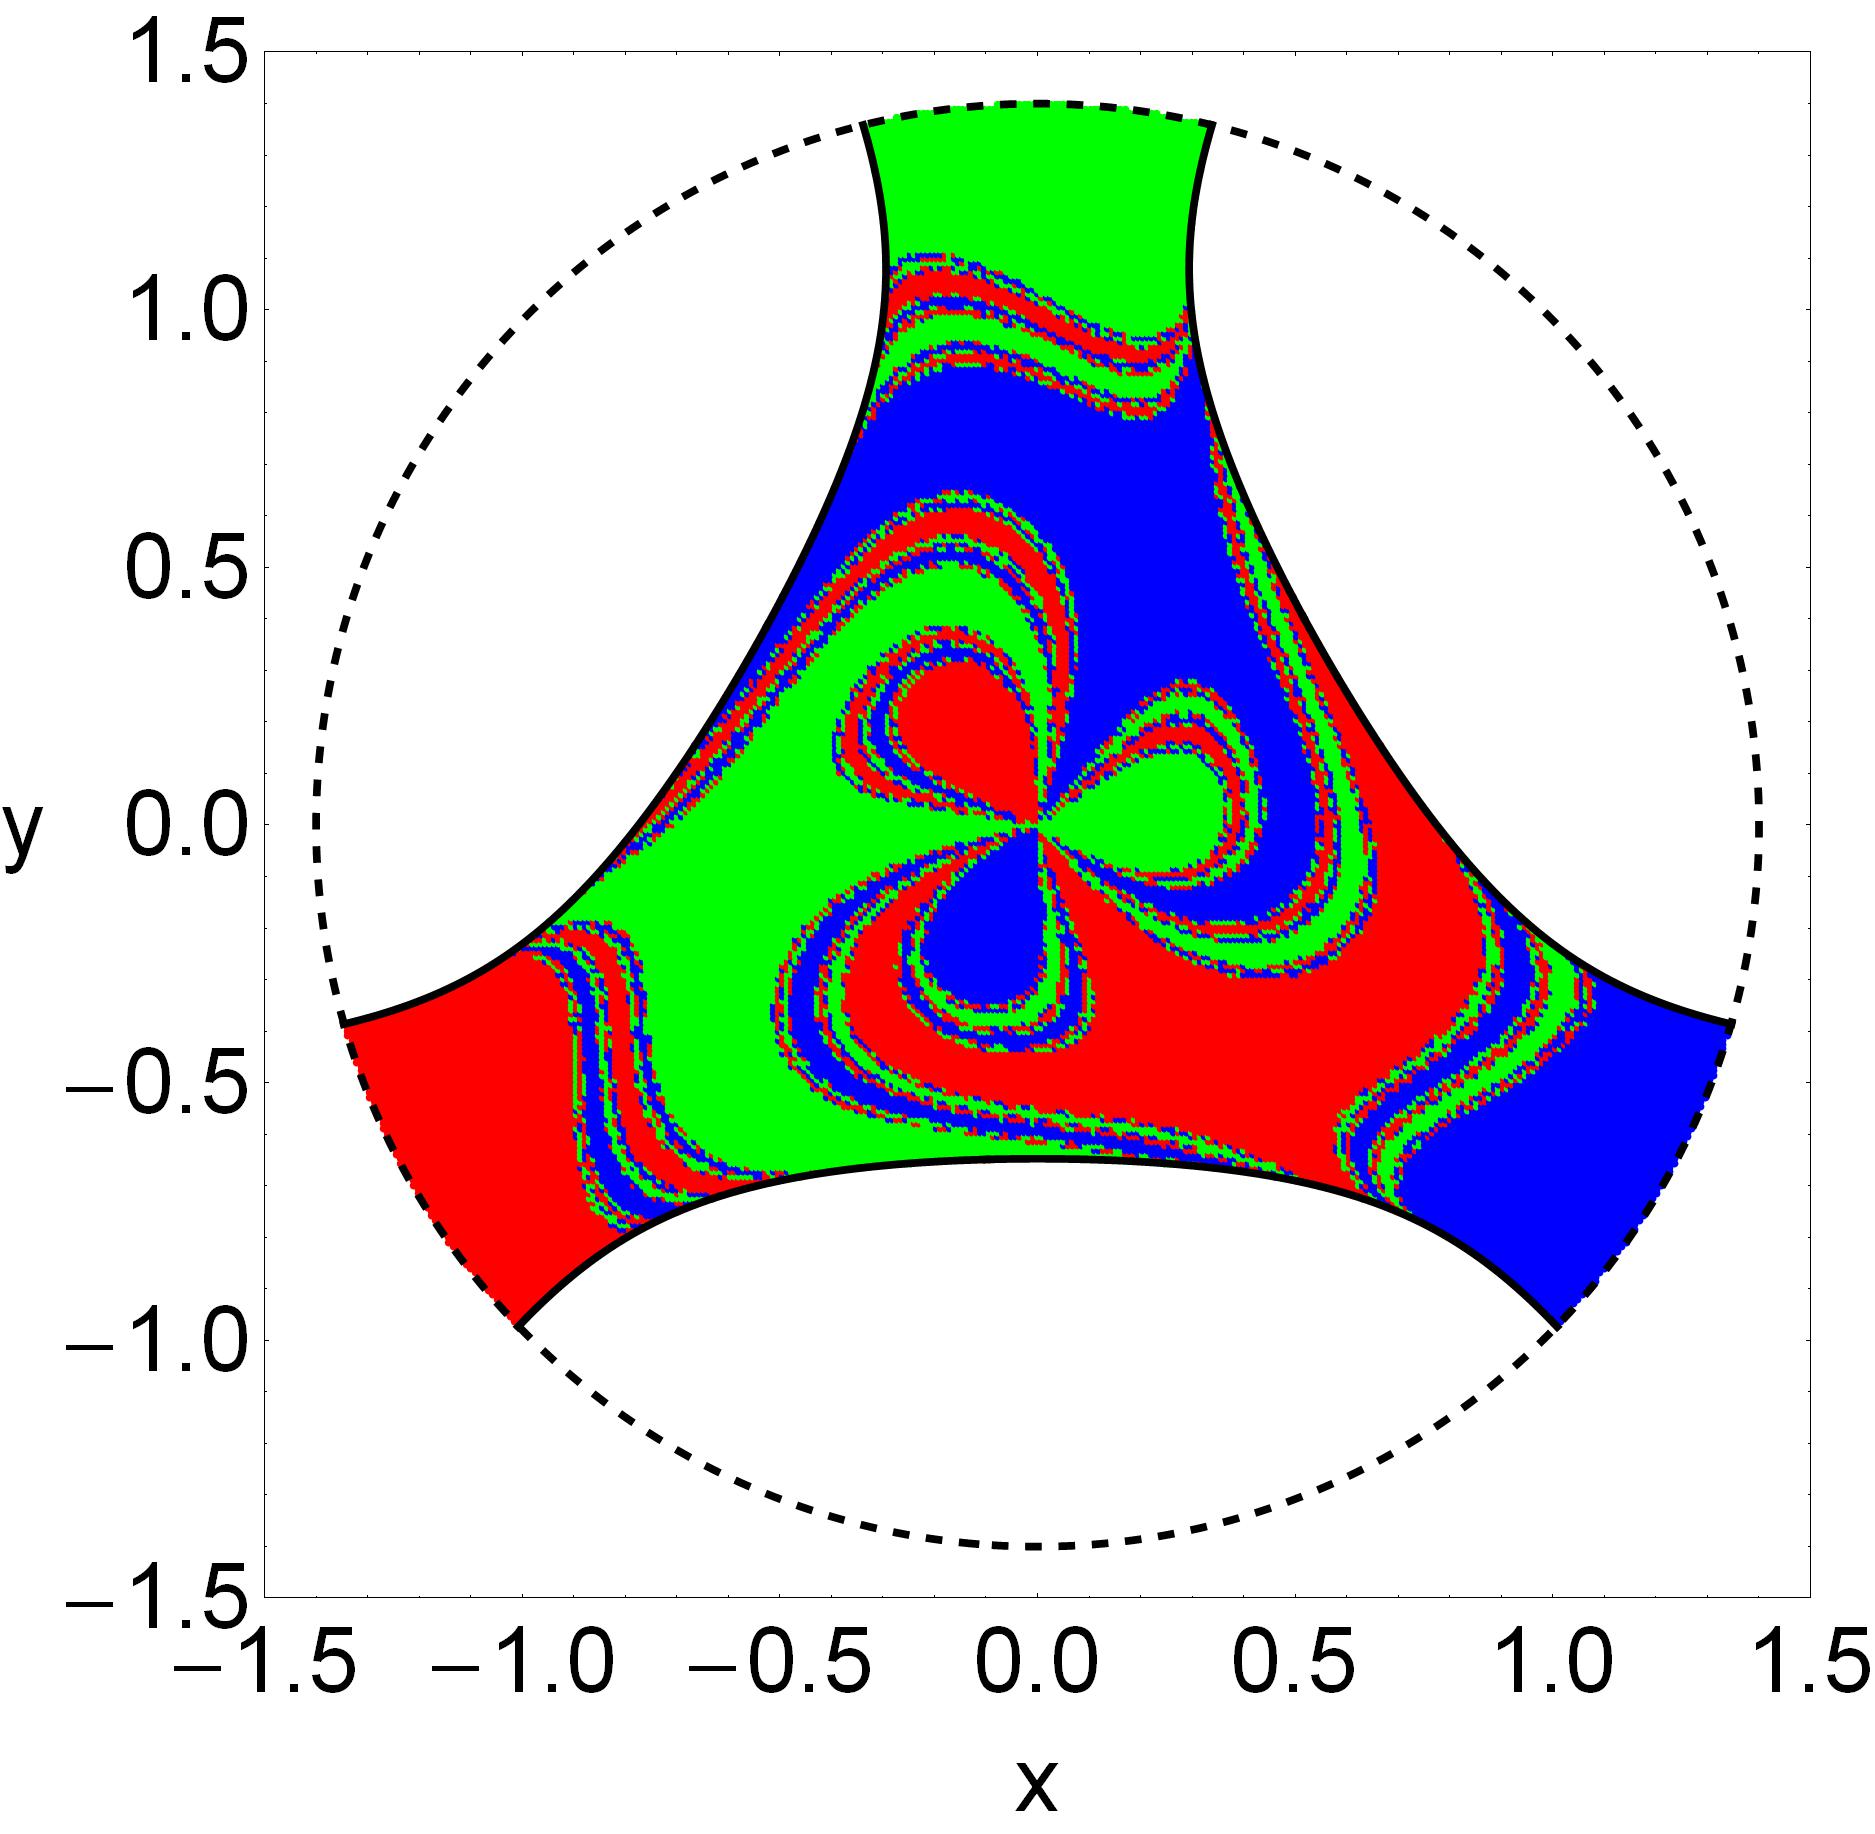
For a much higher total energy the data corresponds to the following color-coded diagram
Now the central region is occupied by extended well-formed basins of escape. By the term "basin" we refer to local sets of initial conditions that lead to the same final state.
Obviously, in the first case it is very difficult, or even impossible, to predict the final state of the initial conditions located in the central region, while in the second case the same task is much easier.
My question: Is there a way to load the data files (with the three columns) into Mathematica and somehow compute the degree of unpredictability/fractality/chaoticity (name it as you want!)? In other words, I want to scan the data files and determine how randomly (or not) the several final states are distributed on the configuration (x,y) plane. The computations should produce a number.
Is this task doable? Any ideas?
Many thanks in advance!
How to create the color-coded diagrams:
m = Import["E017.out", "Table"];

getColor[m_List, i_Integer] := Module[{s = m[[i, 3]]},
Which[s == -1, Black, s == 0, Cyan, s == 1, Green, s == 2, Red, s == 3, Blue]];
data = Table[{PointSize[0.005], getColor[m, i], Point[{m[[i, 1]], m[[i, 2]]}]},
{i, 1, Length[m]}];

V = 1/2*(x^2 + y^2) - y*(1/3*y^2 - x^2);
h = 0.17;
xmin = 1.5;
rad = 1.4;

S0 = Graphics[data];

S1 = ContourPlot[V == h, {x, -xmin, xmin}, {y, -xmin, xmin},
ContourStyle -> {{Black, Thickness[0.005]}}, AspectRatio -> 1,
ContourShading -> False, PlotPoints -> 200,
RegionFunction -> Function[{x, y}, Sqrt[x^2 + y^2] <= rad],
PerformanceGoal -> "Quality"];

lim = ContourPlot[
Sqrt[x^2 + y^2] == rad, {x, -xmin, xmin}, {y, -xmin, xmin},
ContourStyle -> {{Black, Dashed, Thickness[0.005]}},
AspectRatio -> 1, ContourShading -> False, PlotPoints -> 200,
PerformanceGoal -> "Quality"];

P0 = Show[{S0, S1, lim}, Axes -> False, Frame -> True,
FrameLabel -> {"x", "y"}, RotateLabel -> False,
LabelStyle -> Directive[FontFamily -> "Helvetica", 22],
AspectRatio -> 1, PlotRange -> xmin, PlotRangeClipping -> True,
PlotRangePadding -> 0, ImageSize -> 450];
EDIT
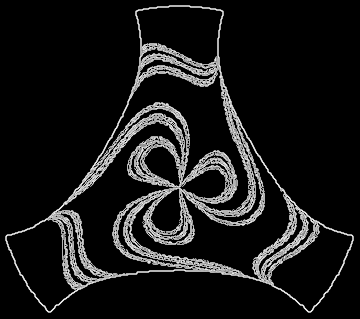
According to the method proposed by bill s, we can determine the areas on the configuration (x,y) plane where the unpredictability, regarding the final state, is high.
S2 = Graphics[data[m2]];
f2 = GradientFilter[Image[S2], 1]
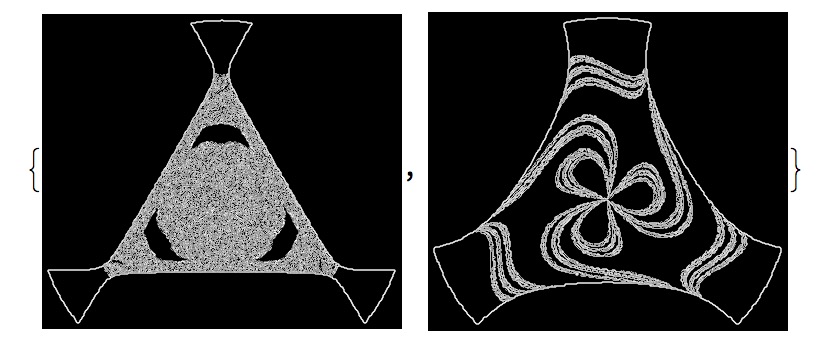
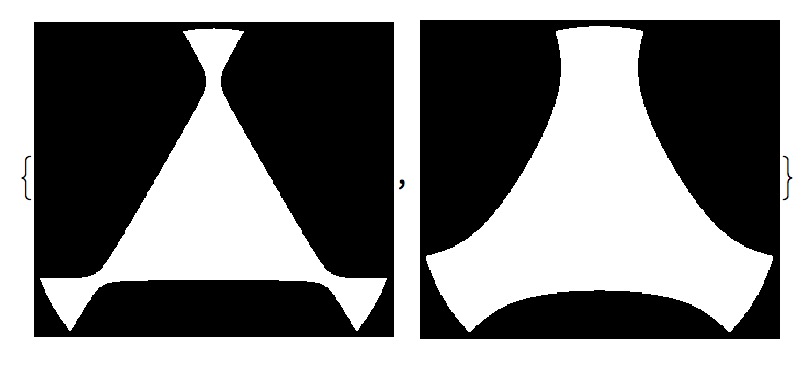
The white areas of the above diagram are the regions of high unpredictability.
Question: How can we create a new list, let's say data2, containing those initial conditions of the original data file, which correspond to the "white" areas?

Import::fmterr: Cannot import data as BYU format..$\endgroup$