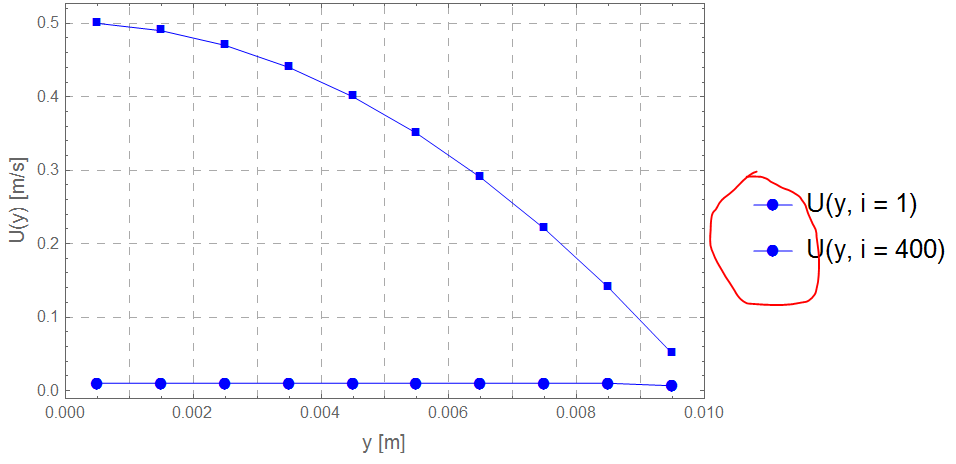
I would like to plot a graph with the legends at its side. However, I have managed to plot the legends, but the markers do not match the one in plot (picture bellow):

My code for that plot is:
ListPlot[{Table[{(n - 1/2)*1/1000, VelocityU[[1, n]]}, {n, 1, NN}],
  Table[{(n - 1/2)*1/1000, VelocityU[[SI, n]]}, {n, 1, NN}]},
 Joined -> True, Filling -> None, PlotMarkers -> Automatic,
 PlotStyle -> {{Blue, Thin}, {Blue, Thin}},
 PlotRange -> {{0, (NN)*1/1000}, Automatic}, Frame -> True,
 FrameLabel -> {"y [m]", "U(y) [m/s]"},
 GridLines -> {Range[1/1000, 1/100, 0.001], Automatic},
 GridLinesStyle -> {{Dashed, Lighter[Gray], Thin}, {Dashed,
    Lighter[Gray], Thin}},
 FrameTicksStyle -> Directive[FontSize -> 8],
 PlotLegends -> {"U(y, i = 1)", "U(y, i = 400)"}]
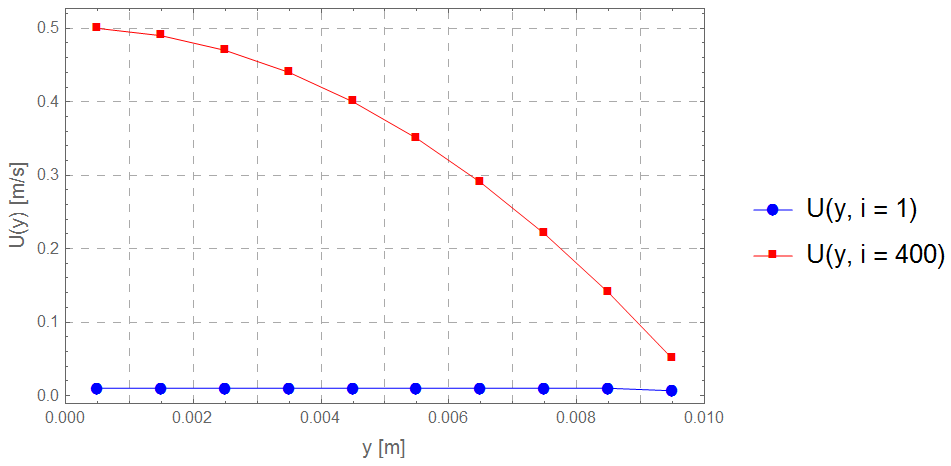
I have managed to solve the problem with the modified code: PlotStyle -> {{Blue, Thin}, {Red, Thin}}, but I still cannot plot proper markers, if I want to keep the blue color for both lines.

And the last question, how to reduce the font size in the legend?
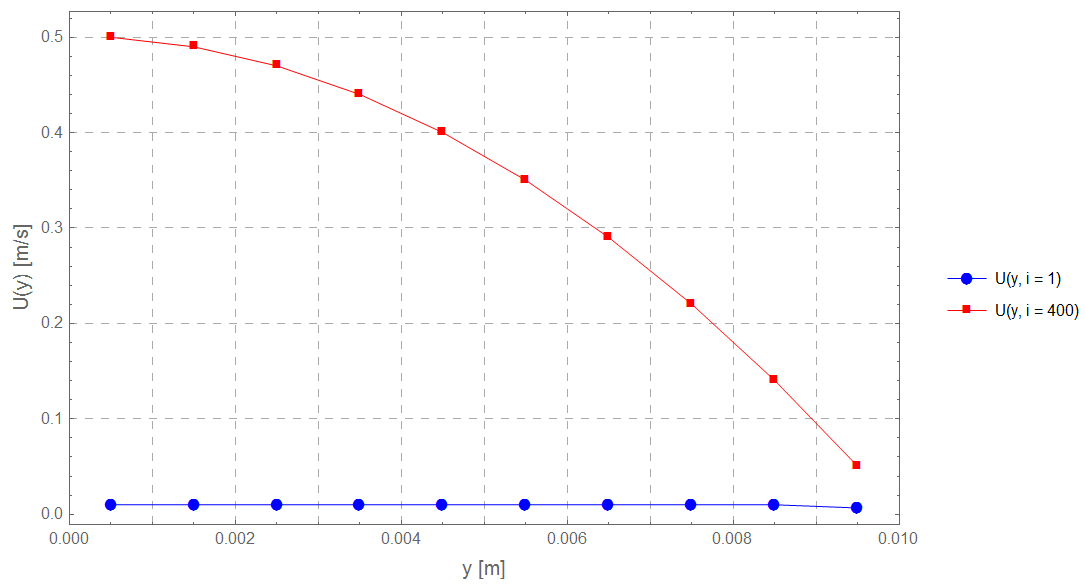
My final and working solution on my OS is the following:
ListPlot[{Table[{(n - 1/2)*1/1000, VelocityU[[1, n]]}, {n, 1, NN}],
  Table[{(n - 1/2)*1/1000, VelocityU[[SI, n]]}, {n, 1, NN}]},
 Joined -> True, PlotMarkers -> Automatic, Filling -> None,
 PlotStyle -> {{Blue, Thin}, {Red, Thin}},
 PlotRange -> {{0, (NN)*1/1000}, Automatic}, Frame -> True,
 FrameLabel -> {"y [m]", "U(y) [m/s]"},
 GridLines -> {Range[1/1000, 1/100, 0.001], Automatic},
 GridLinesStyle -> {{Dashed, Lighter[Gray], Thin}, {Dashed,
    Lighter[Gray], Thin}},
 FrameTicksStyle -> Directive[FontSize -> 8],
 PlotLegends ->
  LineLegend[{"U(y, i = 1)", Row[{"U(y, i = ", ToString[SI], ")"}]},
   LegendMarkers -> {Automatic, Automatic}, LabelStyle -> 8]]
Final plot:


