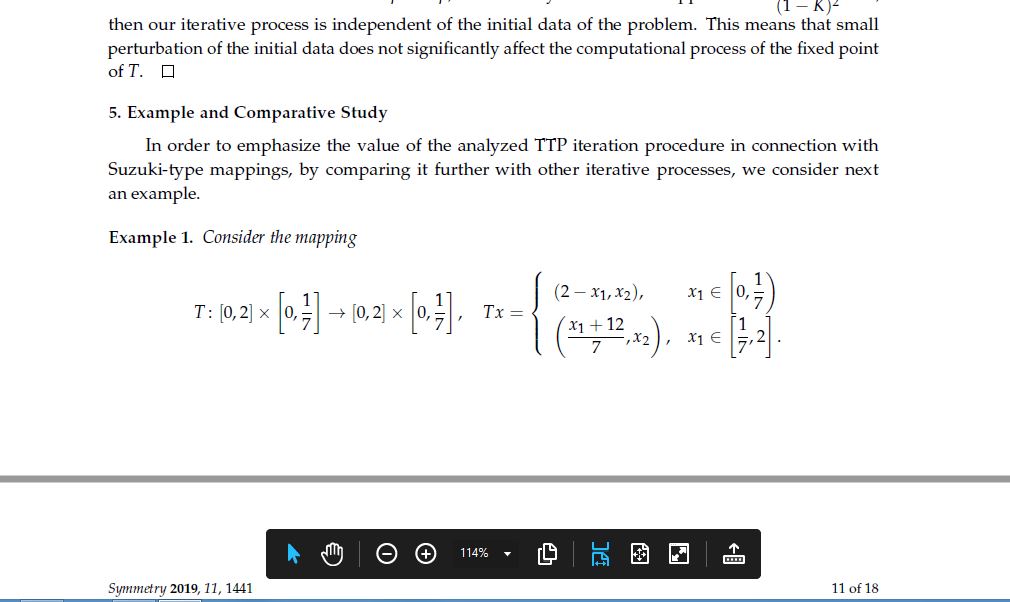
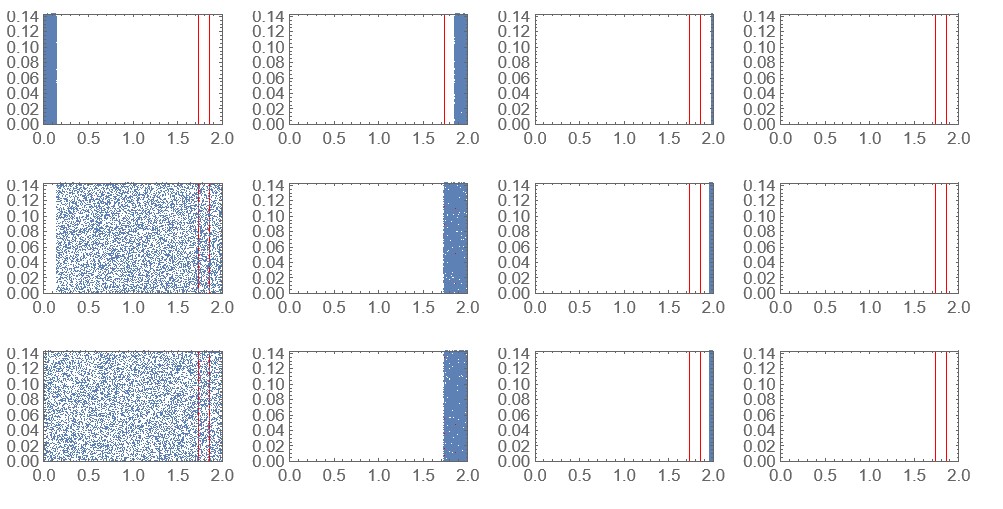
I have a mapping T as attached (here . Now for $x_{0}\in C$ the Mann iteration process read as $x_{n+1}=(1-\alpha_{n})x_{n}+\alpha_{n}Tx_{n}$ n=0,1,2,3,... Now I want to obtain a visualization of the paper and plot given in the paper https://www.mdpi.com/2073-8994/11/12/1441
I know only the techniques that Mann iteration converges to a fixed point of a certain mapping as
a[n]=0.9;
x[0]=0.5;
T[x_]:=T[x]=x^2;
x[n]=(1-a[n-1])x[n-1]+x[n-1]T[x[n-1]]
But I do not to get figure like in the given paper. The Matlab code there is given but I do not like Matlab. I will be thankful if anyone can suggest me this implementation in mathematica.

