Is there an automatic function inserts y-values as PlotMarkers?
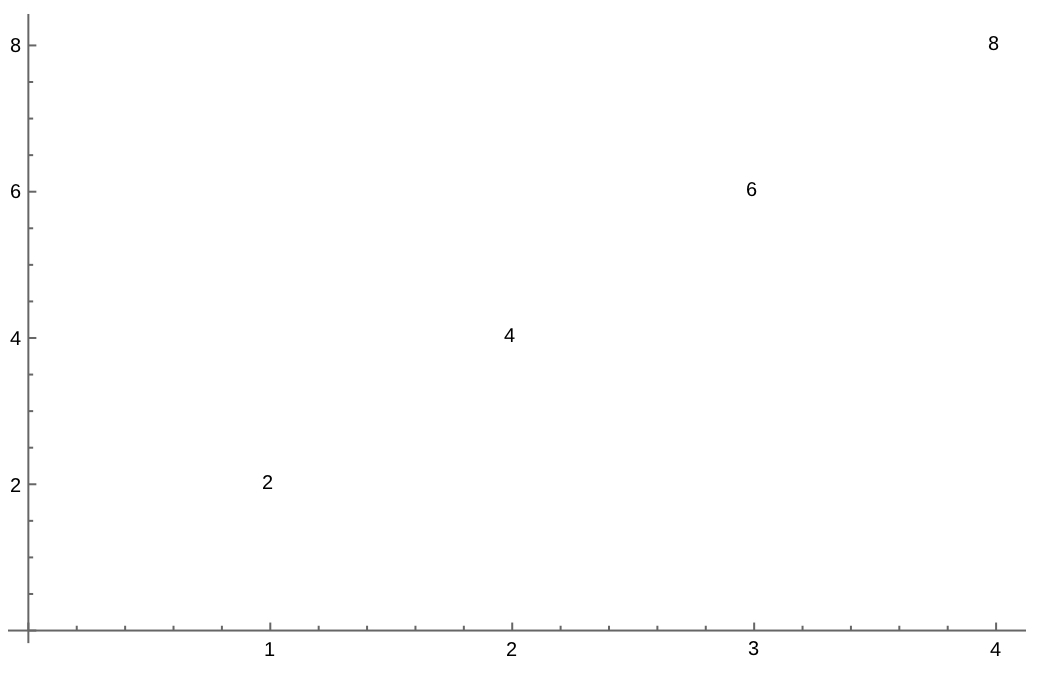
For instance, suppose I wish these four points in ListPlot to display as their values (2, 4, 6, and, 8 respectively):
ListPlot[#,PlotMarkers->#]&@{2,4,6,8}
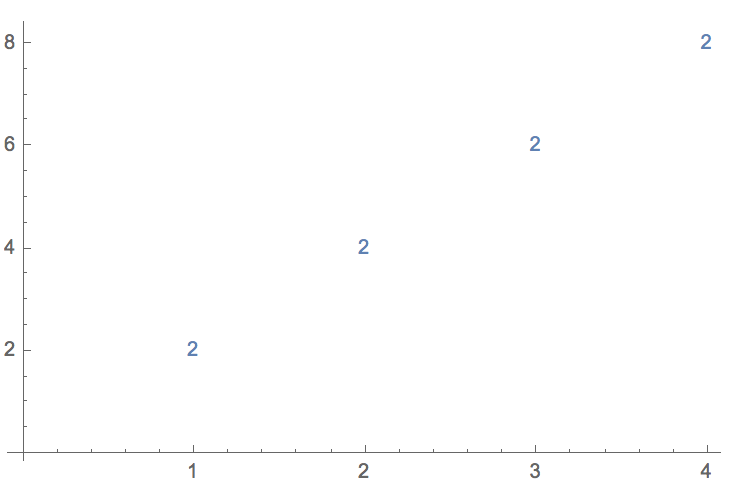
This is what I get instead:
This is a duplicate of these two questions:
ListPlot with plotmarkers determined by point
ListPlot, PlotMarker -> y value
But since these were asked and answered in 2012 and 2014, respectively, and since MMA's functionality has expanded significantly since that time, I thought it was worth repeating the inquiry.


ListPlot[List /@ Thread[{Range[Length[#]], #}], PlotMarkers -> #, PlotRange -> {{0, 4.1}, Automatic}] &@{2, 4, 6, 8}If you don't want the different colors, include the optionPlotStyle -> ColorData[97][1]$\endgroup$