9
$\begingroup$

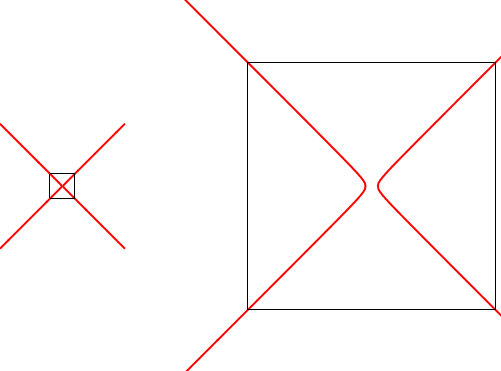
I want to combine two images to create a zoomed callout, as illustrated below.

zoom callout

The plot on the right is the zoomed in version of the boxed area on the left. The dotted lines connect the corresponding box corners.

I would like to be able to change the location and size of the zoom callout (the right plot) as well as which dotted lines are shown.

This is the code I used to make the plots:

bigplot = ContourPlot[x^2 - y^2 == 1/10000, {x, -1, 1}, {y, -1, 1}, ContourStyle -> Directive[Red, Thick], Frame -> None];
xrange = {-1/10, 1/10};
yrange = {-1/10, 1/10};
rect = Graphics[{EdgeForm[Directive[Black, Thick]], Opacity[0], Rectangle[Sequence @@ Transpose[{xrange, yrange}]]}];

combined = Show[bigplot, rect]
zoomedplot = ContourPlot[x^2 - y^2 == 1/10000, {x, xrange[[1]], xrange[[2]]}, {y, yrange[[1]], yrange[[2]]}, ContourStyle -> Directive[Red, Thick], FrameTicks -> None, PlotRangePadding -> None]

I think a solution would use Inset. However, I do not understand how the pos argument works.

$\endgroup$

2 Answers 2

3
$\begingroup$

Here is one (incomplete) approach.

zoomerize[plot : Graphics[g_, stuff___], range_] := Module[{
    gRange, newG, trans = 5, scale = 10},

   gRange = PlotRange /. AbsoluteOptions[plot];
   gRange = gRange /. {{xmin_, xmax_}, {ymin_, ymax_}} :>
      {{xmin, xmax + trans + 1/scale + 1}, 3 {ymin, ymax}};

   newG = {g, Transparent, EdgeForm[Black], Rectangle @@ Transpose[range]};

   Graphics[{newG,
     Translate[Scale[newG, scale {1, 1}, Mean /@ range], trans {1, 0}]},
      PlotRange -> gRange, ImageSize -> Large]];

zoomerize[ContourPlot[x^2 - y^2 == 1/10000, {x, -1, 1}, {y, -1, 1},
  PlotPoints -> 200, ContourStyle -> Directive[Red, Thick], 
  Frame -> None], {{-1, 1}, {-1, 1}}/5]

enter image description here

For this code, the arithmetic for offsetting things would need to be fixed, lines need to be added, etc. But hopefully it gives people ideas. Most importantly, remember that everything is a structure, including the output of plots. Note you could also intercept the specification for the contour plot itself:

SetAttributes[zoomerize, HoldFirst];
zoomerize[ContourPlot[f_, r1_, r2_, options___]] := ...

And regarding the position argument of Inset, think of it as pinning. You specify a place to put a pin on one object (say its bottom-left corner) and you specify a place to put a pin on the other object (say its center). Then Inset will align those pins.

$\endgroup$
2
$\begingroup$

Here is a partial solution using Inset. First, the result:
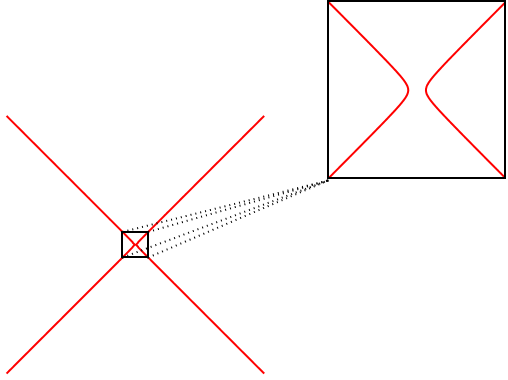
result

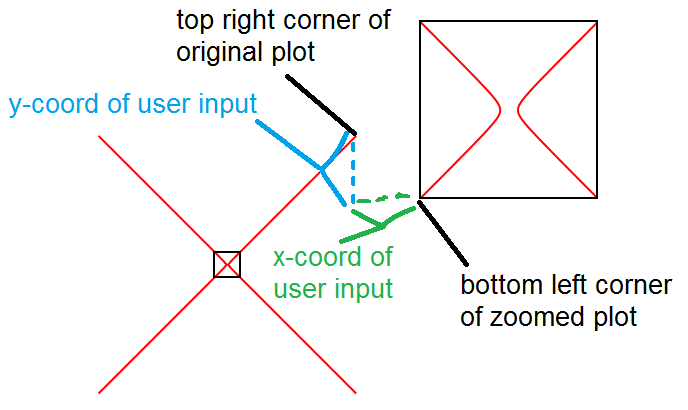
What helped me understand how Inset worked, was to first fix my mindset. I decided to position the zoomed region by placing its bottom left corner a certain distance away from the top right corner of the original plot.

The placement of the zoomed plot is accomplished by (in pseudo-code)

Inset[zoomed plot, bottom left corner of zoomed plot, {Left, Bottom}]

I then can define

bottom left corner of zoomed plot = (top right corner of original plot) + (user input)

which can be visualized in the following:
choice of variables

Now for the code. First are the inputs:

(* equation to plot *)
eqn = x^2 - y^2 == 1/10000;
(* original range *)
or = {{-1, 1}, {-1, 1}};
(* zoomed range *)
zr = or/10;
(* user input, as illustrated above *)
userin = {0.5, -0.5};

Then the rest necessary to plot everything:

(* all corners of the box determined by zoomed range *)
bl = First@Transpose@zr; (* bottom left *)
tr = Last@Transpose@zr; (* top right *)
zcorners = Flatten[Table[{i, j}, {i, bl[[1]], tr[[1]], tr[[1]] - bl[[1]]}, {j, bl[[2]], tr[[2]], tr[[2]] - bl[[2]]}], 1];

(* top right corner of original plot *)
topright = Last@Transpose@or;

(* original plot *)
oplot = ContourPlot[Evaluate@eqn, {x, or[[1, 1]], or[[1, 2]]}, {y, or[[2, 1]], or[[2, 2]]}, ContourStyle -> Directive[Red, Thick], Frame -> None, PlotPoints -> 50];

(* zoomed plot *)
zplot = ContourPlot[Evaluate@eqn, {x, zr[[1, 1]], zr[[1, 2]]}, {y, zr[[2, 1]], zr[[2, 2]]}, ContourStyle -> Directive[Red, Thick], FrameTicks -> None, PlotRangePadding -> None, PlotPoints -> 50, FrameStyle -> Thick];

(* zoomed rectangle *)
zrect = {EdgeForm[Directive[Black, Thick]], Opacity[0], Rectangle[Sequence @@ Transpose[zr]]};

(* based on how I choose to position everything, I will make the zoomed plot's bottom left corner start at zbasepos *)
zbasepos = topright + userin;

(* the lines *)
line1 = {Dotted, Thick, Line[{zcorners[[1]], zbasepos}]};
line2 = {Dotted, Thick, Line[{zcorners[[2]], zbasepos}]};
line3 = {Dotted, Thick, Line[{zcorners[[3]], zbasepos}]};
line4 = {Dotted, Thick, Line[{zcorners[[4]], zbasepos}]};

(* show everything *)
Graphics[{First@oplot, zrect, line1, line2, line3, line4, Inset[zplot, zbasepos, {Left, Bottom}]}]

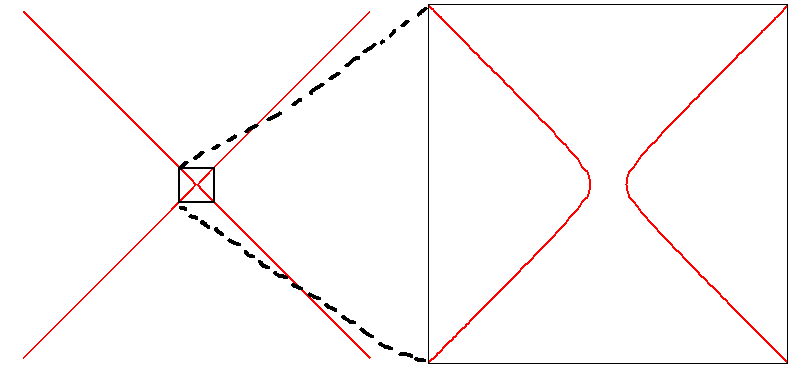
I say this is a partial solution because I cannot accurately determine the corners of the Inset box after scaling the image (using a mouse). Hence why I chose to send all the lines to the bottom left corner.
$\endgroup$

Your Answer

By clicking “Post Your Answer”, you agree to our terms of service and acknowledge you have read our privacy policy.

Not the answer you're looking for? Browse other questions tagged or ask your own question.