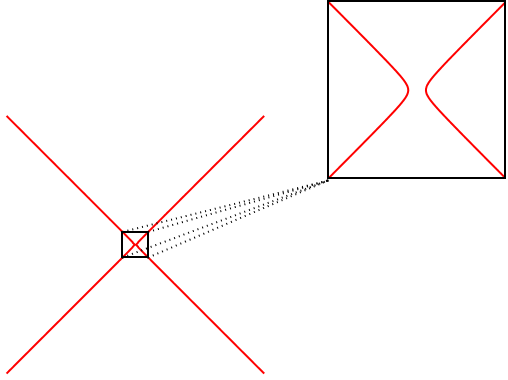
Here is a partial solution using Inset. First, the result:

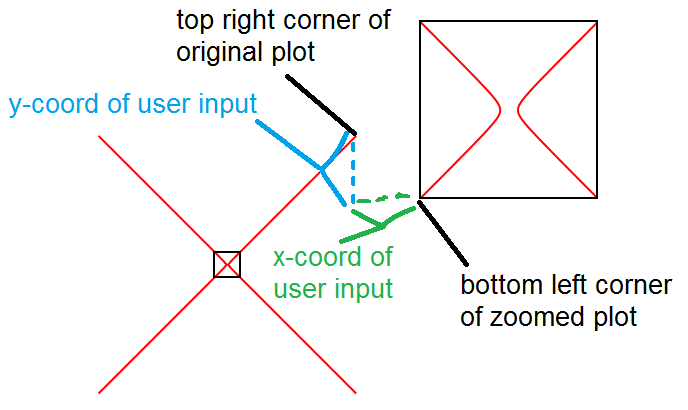
What helped me understand how Inset worked, was to first fix my mindset. I decided to position the zoomed region by placing its bottom left corner a certain distance away from the top right corner of the original plot.
The placement of the zoomed plot is accomplished by (in pseudo-code)
Inset[zoomed plot, bottom left corner of zoomed plot, {Left, Bottom}]
I then can define
bottom left corner of zoomed plot = (top right corner of original plot) + (user input)
which can be visualized in the following:

Now for the code. First are the inputs:
(* equation to plot *)
eqn = x^2 - y^2 == 1/10000;
(* original range *)
or = {{-1, 1}, {-1, 1}};
(* zoomed range *)
zr = or/10;
(* user input, as illustrated above *)
userin = {0.5, -0.5};
Then the rest necessary to plot everything:
(* all corners of the box determined by zoomed range *)
bl = First@Transpose@zr; (* bottom left *)
tr = Last@Transpose@zr; (* top right *)
zcorners = Flatten[Table[{i, j}, {i, bl[[1]], tr[[1]], tr[[1]] - bl[[1]]}, {j, bl[[2]], tr[[2]], tr[[2]] - bl[[2]]}], 1];

(* top right corner of original plot *)
topright = Last@Transpose@or;

(* original plot *)
oplot = ContourPlot[Evaluate@eqn, {x, or[[1, 1]], or[[1, 2]]}, {y, or[[2, 1]], or[[2, 2]]}, ContourStyle -> Directive[Red, Thick], Frame -> None, PlotPoints -> 50];

(* zoomed plot *)
zplot = ContourPlot[Evaluate@eqn, {x, zr[[1, 1]], zr[[1, 2]]}, {y, zr[[2, 1]], zr[[2, 2]]}, ContourStyle -> Directive[Red, Thick], FrameTicks -> None, PlotRangePadding -> None, PlotPoints -> 50, FrameStyle -> Thick];

(* zoomed rectangle *)
zrect = {EdgeForm[Directive[Black, Thick]], Opacity[0], Rectangle[Sequence @@ Transpose[zr]]};

(* based on how I choose to position everything, I will make the zoomed plot's bottom left corner start at zbasepos *)
zbasepos = topright + userin;

(* the lines *)
line1 = {Dotted, Thick, Line[{zcorners[[1]], zbasepos}]};
line2 = {Dotted, Thick, Line[{zcorners[[2]], zbasepos}]};
line3 = {Dotted, Thick, Line[{zcorners[[3]], zbasepos}]};
line4 = {Dotted, Thick, Line[{zcorners[[4]], zbasepos}]};

(* show everything *)
Graphics[{First@oplot, zrect, line1, line2, line3, line4, Inset[zplot, zbasepos, {Left, Bottom}]}]
I say this is a partial solution because I cannot accurately determine the corners of the Inset box after scaling the image (using a mouse). Hence why I chose to send all the lines to the bottom left corner.


