1
$\begingroup$

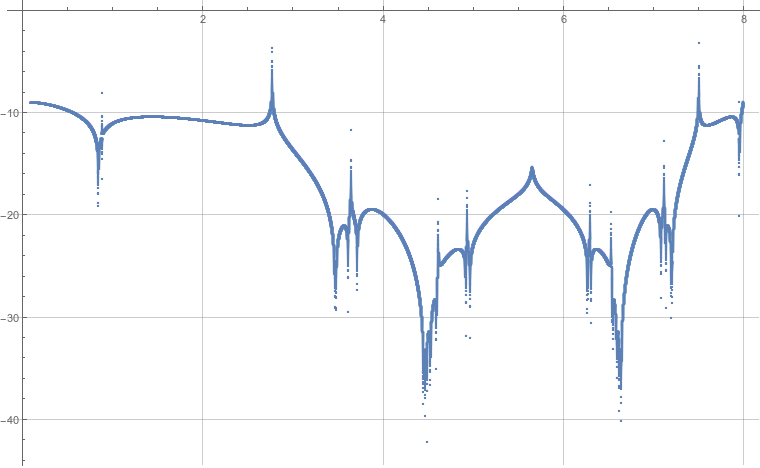
I have two listplots (see below), and I want to combine them in one single plot. Show[] doesn't work because they have different vertical scales. There is a guide here, but that's a bit complicated to me. I don't care about the scale, I just want to put them in one single plot so that I can compare the minima of the two plots. Problem is that for the first plot, some of the values tend to infinity, and I am not really interested in those points (if I just plot it individually, I am pleased with the PlotRange given by mathematica which is what is shown here). The second plot is alright as it is in Logscale and the full range is pretty much what's shown here.

Any simple way to do this, except scaling the y-axis manually so the two plots have comparable vertical scale?

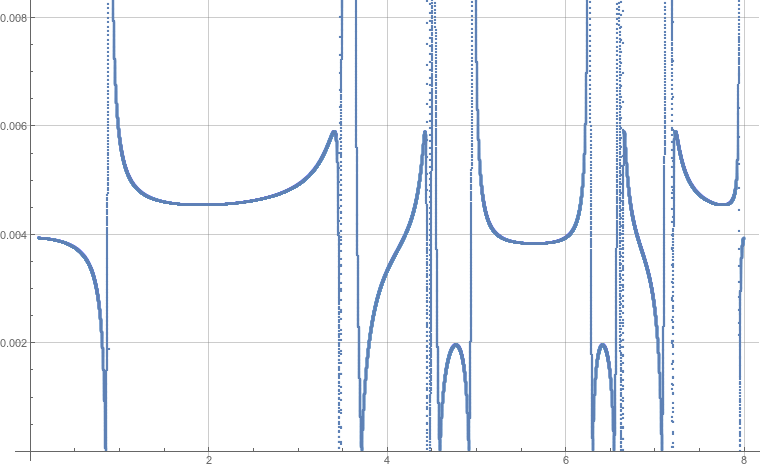
fig1 fig2

$\endgroup$
3
  • 1
    $\begingroup$ Does ListPlot[Rescale/@{f1,f2}] do what you want? $\endgroup$
    – N.J.Evans
    Commented Sep 21, 2016 at 15:15
  • $\begingroup$ If you don't care about the scale, you might just Overlay them. Looks like i.sstatic.net/q0Gzd.png $\endgroup$
    – Karsten7
    Commented Sep 21, 2016 at 15:18
  • $\begingroup$ See here and here. $\endgroup$
    – corey979
    Commented Sep 21, 2016 at 17:42

2 Answers 2

1
$\begingroup$

If f1 is the first plot and f2 the second you can do:

ListPlot[{f1, f2}]

The outcome is in one plot. Does this help?

$\endgroup$
1
  • $\begingroup$ but as you can see they have different scales. f1 ranges from 0 to infinity, but I am only interested in regions near the zero (shown in the graph). f2 is a log plot so the current range is ok to me. If I just use ListPlot[{f1,f2}] without any processing, I can't see both of them. What I want is to combine what we 'see' here for the two plots in one single plot, and I don't care about the scale. $\endgroup$
    – Physicist
    Commented Sep 21, 2016 at 11:59
1
$\begingroup$

If all you want is a quick-and-dirty way to compare the minima, then this should work:

scaledoffsetf2[a_, b_] = ({#[[1]], a*#[[2]] + b} &) /@ f2;
Manipulate[ListPlot[{f1, scaledoffsetf2[a, b]}], {a, -1, 1}, {b, -1, 1}]

Adjust a and b in the sliders in the resulting output until you get something that you like. If you need f2 to be plotted on a logarithmic scale, replace #[[2]] with Log[#[[2]]] in the above code.

$\endgroup$

Your Answer

By clicking “Post Your Answer”, you agree to our terms of service and acknowledge you have read our privacy policy.

Not the answer you're looking for? Browse other questions tagged or ask your own question.