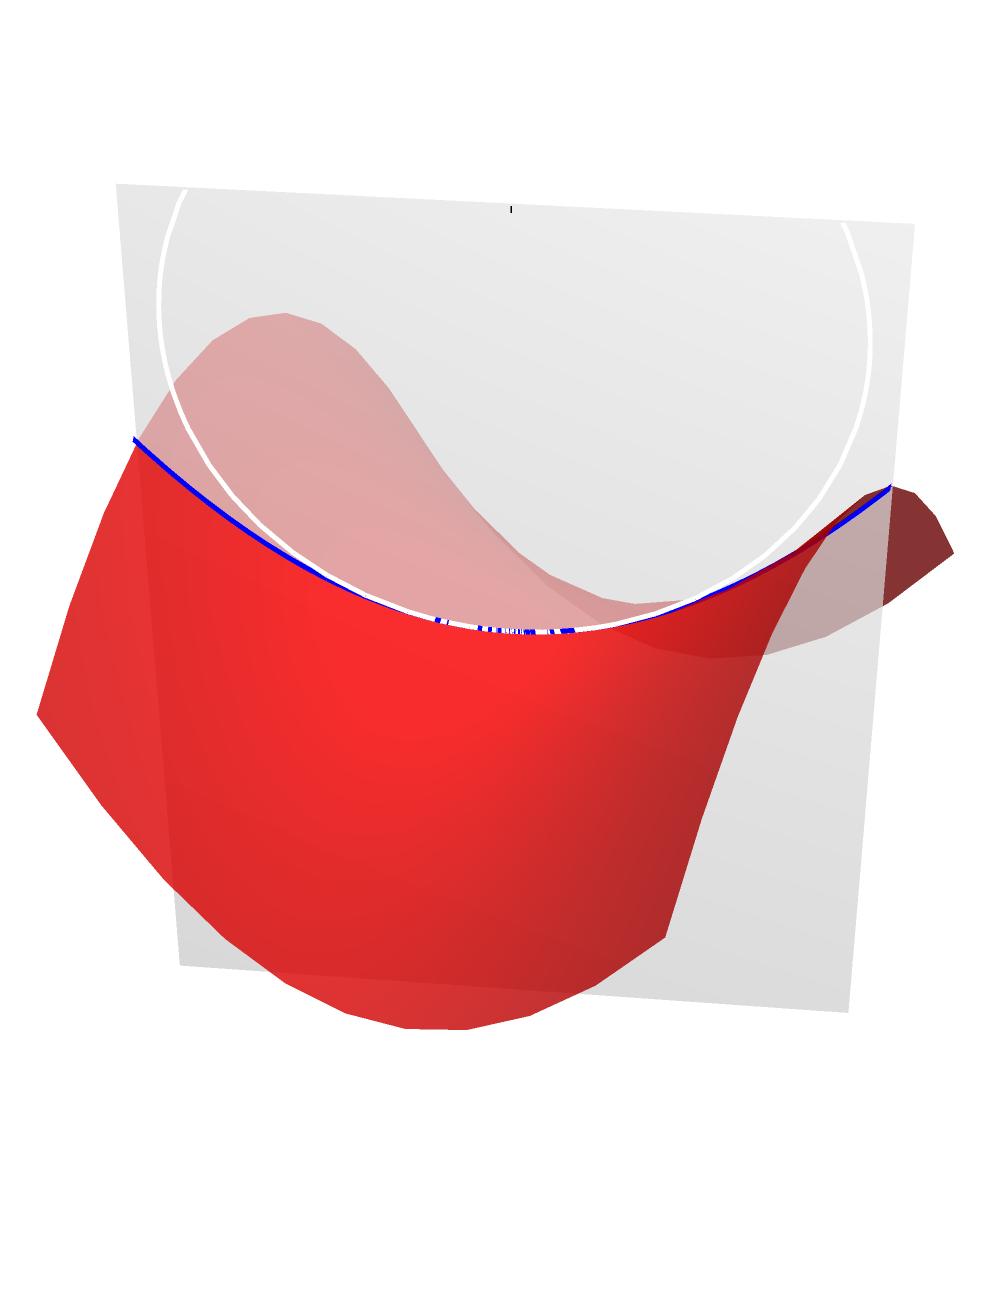
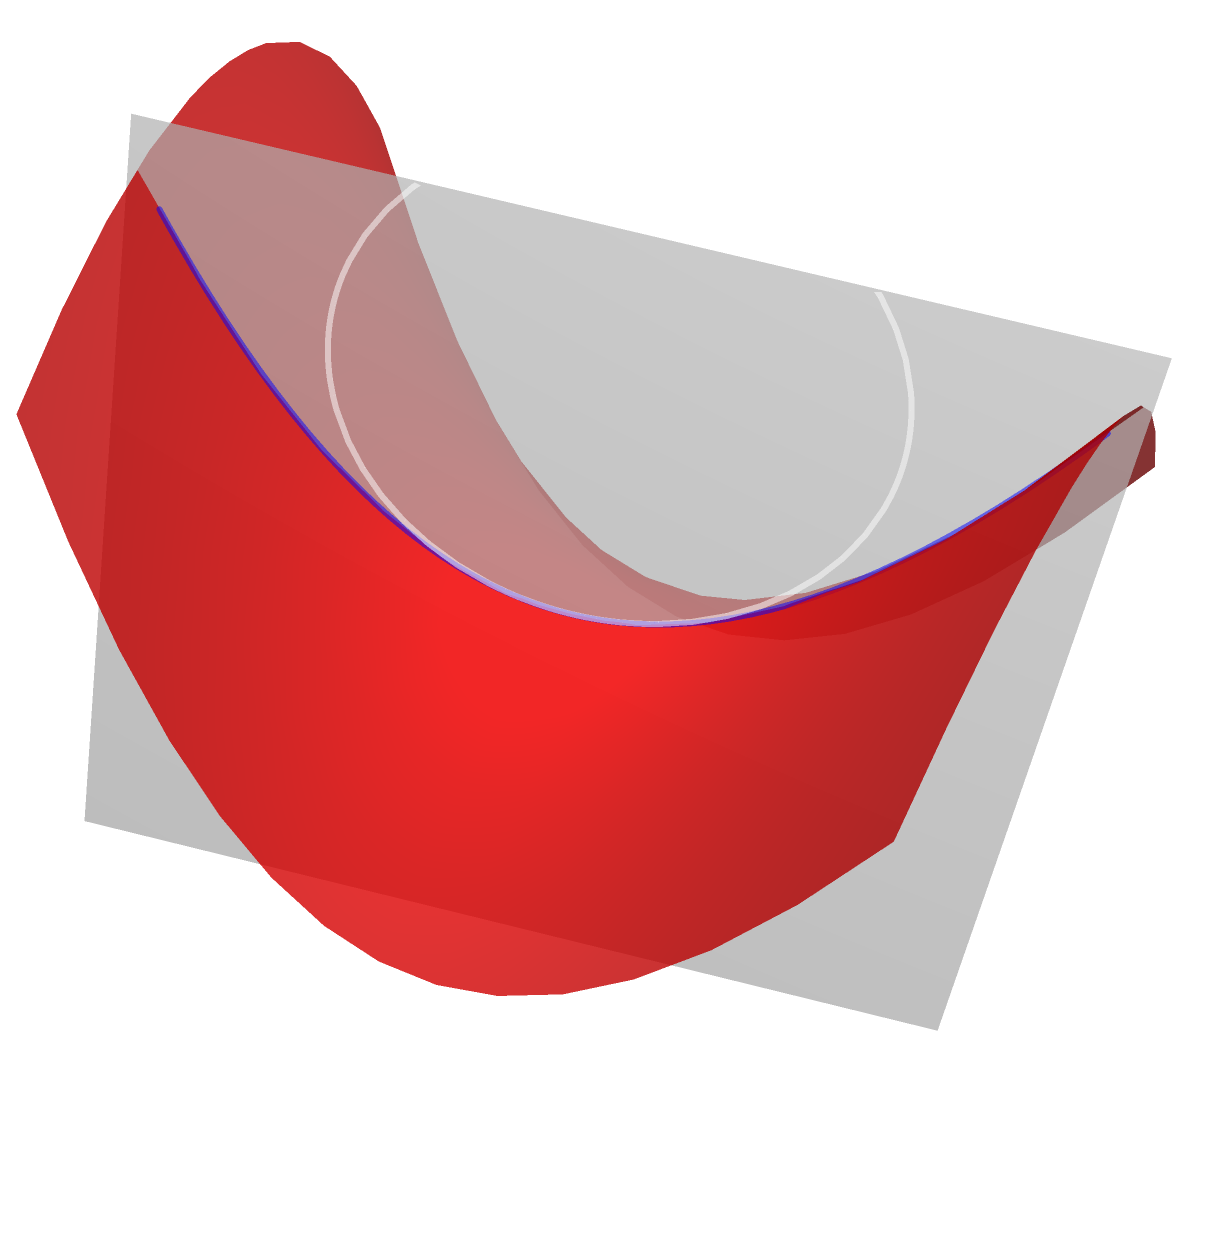
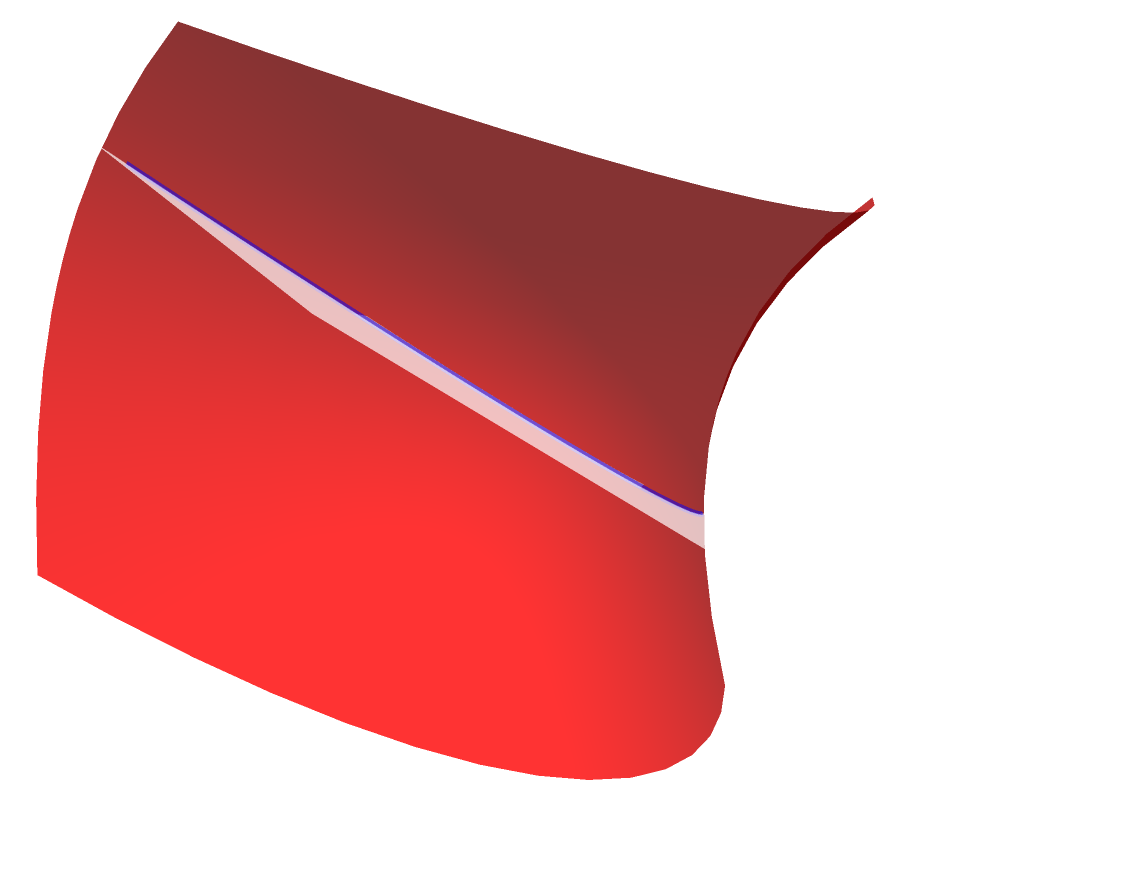
I use the command Show to combine plots of mathematica. For instance, the code below produces the picture below. As you can see there is some "noise" where the two curves overlap. Is there a way to avoid this? I tried playing around with Overlay, but this did not help.
point = {0, 0};
angle = Pi/4;

sur[p_List] := {p[[1]], p[[2]], p[[1]]^2 - p[[2]]^2};
cur[p_List, alpha_, s_] := sur[p + s*{Cos[alpha], Sin[alpha]}];
veloc[p_List, alpha_, s_] := D[cur[p, alpha, xi], xi] /. xi -> s;
acc[p_List, alpha_, s_] := D[veloc[p, alpha, xi], xi] /. xi -> s;
velocnorm[p_List, alpha_, s_] := veloc[p, alpha, s]/Norm[veloc[p, alpha, s]]
parx[p_List] := D[sur[{x, y}], x] /. {x -> p[[1]], y -> p[[2]]};
pary[p_List] := D[sur[{x, y}], y] /. {x -> p[[1]], y -> p[[2]]};
basex[p_List] := parx[p]/Norm[parx[p]];
basey[p_List] := (pary[p] - (pary[p].basex[p])*basex[p])/Norm[pary[p] -(pary[p].basex[p])*basex[p]];
gauss[p_List] := Cross[basex[p], basey[p]];
kappa[p_List, alpha_] := If[gauss[p].acc[p, alpha, 0] >= 0, Norm[Cross[veloc[p, alpha, 0],acc[p, alpha, 0]]]/Norm[veloc[p, alpha, 0]]^3, -Norm[Cross[veloc[p, alpha, 0], acc[p, alpha, 0]]]/Norm[veloc[p, alpha, 0]]^3];
tanvector[p_List, alpha_] := Cos[alpha]*basex[p] + Sin[alpha]*basey[p];
surface = ParametricPlot3D[sur[{x, y}], {x, -1, 1}, {y, -1, 1}, PlotStyle -> {Directive[Red, Opacity[0.8]]}, Mesh -> None];
tangentplaneplot[p_List] := ParametricPlot3D[sur[p] + u*basex[p] + v*basey[p], {u, -1, 1}, {v, -1, 1}, PlotStyle -> {White, Opacity[0.7]}, Mesh -> None];
normplaneplot[p_List, alpha_] := ParametricPlot3D[sur[p] + u*velocnorm[p, alpha, 0] + v*gauss[p], {u, -5, 5}, {v, -5,5}, PlotStyle -> {White, Opacity[0.7]}, Mesh -> None,Lighting -> "Neutral"];
curveplot[p_List, alpha_] := ParametricPlot3D[cur[p, alpha, s], {s, -1, 1}, PlotStyle -> {Blue, Thickness[0.005]}];
osccircleplot[p_List, alpha_] := If[kappa[p, alpha] == 0, ParametricPlot3D[sur[p] +zeta*velocnorm[p, alpha, 0], {zeta, -2, 2}],ParametricPlot3D[sur[p] + gauss[p]/kappa[p, alpha]+1/kappa[p, alpha]*(Cos[phi]*gauss[p] + Sin[phi]*velocnorm[p, alpha, 0]), {phi, 0, 2*Pi},PlotStyle -> {White, Thickness[0.005]}]];

xmin = -0.7;
xmax = 0.7;
ymin = -0.7;
ymax = 0.7;
zmin = -1;
zmax = 1;

Show[curveplot[point, angle], osccircleplot[point, angle],normplaneplot[point, angle],surface, Boxed -> False,PlotRange -> {{xmin, xmax}, {ymin, ymax}, {zmin, zmax}},PlotRangeClipping -> False]


LinewithTube. Sometimes, for display purposes, I offset coincident elements to force one to be in front of the other (from a particular viewpoint). It's trickier if you want to rotate the 3D model. $\endgroup$Line[]objects toTube[]objects, tho choosing a tube radius is not always straightforward, and you'd need to experiment. $\endgroup$Linesegments, surfaces ofPolygonobjects that are usually broken down into triangles by the rendering machine. Increasing plot points shortens the line segments curves and improves the truncation error. Similarly it should make a more accurate surface.ImageResolutioncan control some qualities of rendered graphics, but probably not the issues shown in the question, which seem primarily to be issues with plotting. $\endgroup$