added 1 characters in body
Source Link
amr
  • 5.5k
  • 1
  • 24
  • 32

Here is one (incomplete) approach.

zoomerize[plot : Graphics[g_, stuff___], range_] := Module[{
    gRange, newG, trans = 5, scale = 10},
   
   gRange = PlotRange /. AbsoluteOptions[plot];
   gRange = gRange /. {{xmin_, xmax_}, {ymin_, ymax_}} :>
      {{xmin, xmax + trans + 1/scale + 1}, 3 {ymin, ymax}};
   
   newG = {g, Transparent, EdgeForm[Black], Rectangle @@ Transpose[range]};
   
   Graphics[{newG,
     Translate[Scale[newG, scale {1, 1}, Mean /@ range], trans {1, 0}]},
      PlotRange -> gRange, ImageSize -> Large]];

zoomerize[ContourPlot[x^2 - y^2 == 1/10000, {x, -1, 1}, {y, -1, 1},
  PlotPoints -> 200, ContourStyle -> Directive[Red, Thick], 
  Frame -> None], {{-1, 1}, {-1, 1}}/5]
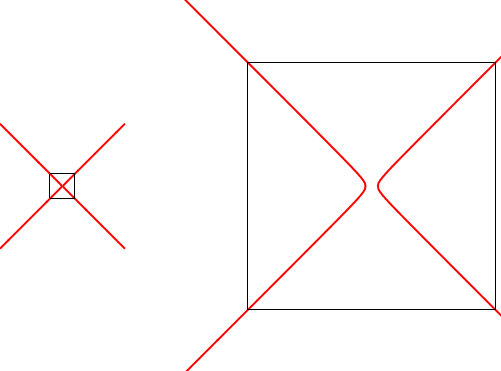
enter image description here

For this code, the arithmetic for offsetting things would need to be fixed, lines need to be added, etc. But hopefully it gives people ideas. Most importantly, remember that everything is a structure, including the output of plots. Note you could also intercept the specification for the contour plot itself:

SetAttributes[zoomerize, HoldFirst];
zoomerize[ContourPlot[f_, r1_, r2_, options___]options___]] := ...

And regarding the position argument of Inset, think of it as pinning. You specify a place to put a pin on one object (say its bottom-left corner) and you specify a place to put a pin on the other object (say its center). Then Inset will align those pins.

Here is one (incomplete) approach.

zoomerize[plot : Graphics[g_, stuff___], range_] := Module[{
    gRange, newG, trans = 5, scale = 10},
   
   gRange = PlotRange /. AbsoluteOptions[plot];
   gRange = gRange /. {{xmin_, xmax_}, {ymin_, ymax_}} :>
      {{xmin, xmax + trans + 1/scale + 1}, 3 {ymin, ymax}};
   
   newG = {g, Transparent, EdgeForm[Black], Rectangle @@ Transpose[range]};
   
   Graphics[{newG,
     Translate[Scale[newG, scale {1, 1}, Mean /@ range], trans {1, 0}]},
      PlotRange -> gRange, ImageSize -> Large]];

zoomerize[ContourPlot[x^2 - y^2 == 1/10000, {x, -1, 1}, {y, -1, 1},
  PlotPoints -> 200, ContourStyle -> Directive[Red, Thick], 
  Frame -> None], {{-1, 1}, {-1, 1}}/5]

enter image description here

For this code, the arithmetic for offsetting things would need to be fixed, lines need to be added, etc. But hopefully it gives people ideas. Most importantly, remember that everything is a structure, including the output of plots. Note you could also intercept the specification for the contour plot itself:

SetAttributes[zoomerize, HoldFirst];
zoomerize[ContourPlot[f_, r1_, r2_, options___] := ...

And regarding the position argument of Inset, think of it as pinning. You specify a place to put a pin on one object (say its bottom-left corner) and you specify a place to put a pin on the other object (say its center). Then Inset will align those pins.

Here is one (incomplete) approach.

zoomerize[plot : Graphics[g_, stuff___], range_] := Module[{
    gRange, newG, trans = 5, scale = 10},
   
   gRange = PlotRange /. AbsoluteOptions[plot];
   gRange = gRange /. {{xmin_, xmax_}, {ymin_, ymax_}} :>
      {{xmin, xmax + trans + 1/scale + 1}, 3 {ymin, ymax}};
   
   newG = {g, Transparent, EdgeForm[Black], Rectangle @@ Transpose[range]};
   
   Graphics[{newG,
     Translate[Scale[newG, scale {1, 1}, Mean /@ range], trans {1, 0}]},
      PlotRange -> gRange, ImageSize -> Large]];

zoomerize[ContourPlot[x^2 - y^2 == 1/10000, {x, -1, 1}, {y, -1, 1},
  PlotPoints -> 200, ContourStyle -> Directive[Red, Thick], 
  Frame -> None], {{-1, 1}, {-1, 1}}/5]

enter image description here

For this code, the arithmetic for offsetting things would need to be fixed, lines need to be added, etc. But hopefully it gives people ideas. Most importantly, remember that everything is a structure, including the output of plots. Note you could also intercept the specification for the contour plot itself:

SetAttributes[zoomerize, HoldFirst];
zoomerize[ContourPlot[f_, r1_, r2_, options___]] := ...

And regarding the position argument of Inset, think of it as pinning. You specify a place to put a pin on one object (say its bottom-left corner) and you specify a place to put a pin on the other object (say its center). Then Inset will align those pins.

Source Link
amr
  • 5.5k
  • 1
  • 24
  • 32

Here is one (incomplete) approach.

zoomerize[plot : Graphics[g_, stuff___], range_] := Module[{
    gRange, newG, trans = 5, scale = 10},
   
   gRange = PlotRange /. AbsoluteOptions[plot];
   gRange = gRange /. {{xmin_, xmax_}, {ymin_, ymax_}} :>
      {{xmin, xmax + trans + 1/scale + 1}, 3 {ymin, ymax}};
   
   newG = {g, Transparent, EdgeForm[Black], Rectangle @@ Transpose[range]};
   
   Graphics[{newG,
     Translate[Scale[newG, scale {1, 1}, Mean /@ range], trans {1, 0}]},
      PlotRange -> gRange, ImageSize -> Large]];

zoomerize[ContourPlot[x^2 - y^2 == 1/10000, {x, -1, 1}, {y, -1, 1},
  PlotPoints -> 200, ContourStyle -> Directive[Red, Thick], 
  Frame -> None], {{-1, 1}, {-1, 1}}/5]

enter image description here

For this code, the arithmetic for offsetting things would need to be fixed, lines need to be added, etc. But hopefully it gives people ideas. Most importantly, remember that everything is a structure, including the output of plots. Note you could also intercept the specification for the contour plot itself:

SetAttributes[zoomerize, HoldFirst];
zoomerize[ContourPlot[f_, r1_, r2_, options___] := ...

And regarding the position argument of Inset, think of it as pinning. You specify a place to put a pin on one object (say its bottom-left corner) and you specify a place to put a pin on the other object (say its center). Then Inset will align those pins.