5
$\begingroup$

I have the following data consisting of x, y pairs and errors of y:

dataWithError = {{0.0333333, 0.0000122672, 0.00000173485}, {0.05, 0.0000371462, 
                  0.00000448037}, {0.0666667, 0.0000697768, 0.00000748151}, 
                 {0.0833333, 0.000108625, 0.000010837}, {0.1, 0.000147595,
                  0.0000136051}, {0.116667, 0.000186599, 0.0000161483}, 
                 {0.133333, 0.000221451, 0.0000179078}, {0.15, 0.000253062, 0.0000192494}};

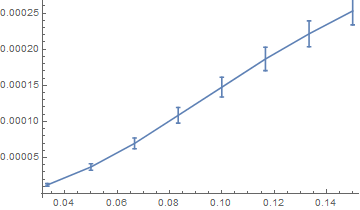
I can plot the data with error bars with:

ErrorListPlot[dataWithError, Joined -> True, PlotRange -> Full]

The result is:

enter image description here

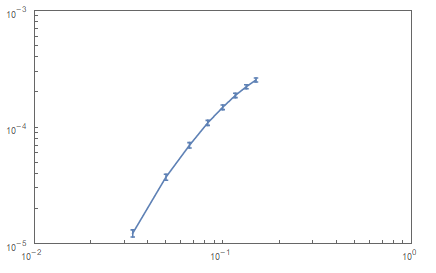
I need a ListLogLogPlot with error bars (both axes have to be logarithmic). How can that be done?

$\endgroup$
4
  • 2
    $\begingroup$ have you tried this $\endgroup$
    – BlacKow
    Commented Apr 2, 2016 at 2:01
  • 2
    $\begingroup$ maybe this: Asymmetric X and Y error bars on ListLogPlot $\endgroup$
    – Kuba
    Commented Apr 2, 2016 at 9:35
  • $\begingroup$ @Kuba: this helps a lot ... thanks for the link $\endgroup$
    – mrz
    Commented Apr 2, 2016 at 13:10
  • $\begingroup$ @BlacKow: that is what I was looking for, but I am surprised that ErrorListLogLogPlot has to be imported and is not included in MMA 10.4, or I am missing some information ... $\endgroup$
    – mrz
    Commented Apr 2, 2016 at 13:13

2 Answers 2

5
$\begingroup$

You can always perform coordinate transformation yourself. There is nothing so special about LogLogPlot. You have to apply Log to your points and plot it with regular ErrorListPlot. Keep in mind that your error bar won't be symmetric in log-log coordinates. After that you have to draw ticks according to your new scale.

This can be overkill for log-log case, but it gives you generic algorithm how to torture your axes any way you want.

Needs["ErrorBarPlots`"]

plotrange={Floor@Log10@Min[#],Ceiling@Log10@Max[#]}&@dataWithError[[All,#]]&/@{1,2};
logData={{Log10[#[[1]]],Log10[#[[2]]]},ErrorBar[Log10[1+0.5#]&/@{-#[[3]]/#[[2]],#[[3]]/#[[2]]} ] }&/@dataWithError;
xticks = {#,Superscript[10,#]}&/@Range[#1,#2,1]&@@plotrange[[1]];
yticks = {#,Superscript[10,#]}&/@Range[#1,#2,1]&@@plotrange[[2]];
{xt,yt}=#~Join~({#,""}&/@Flatten[(#[[1]]+Log10[{2,3,4,5,6,7,8,9}])&/@#])&/@{xticks,yticks};

 ErrorListPlot[logData, Joined -> True, PlotRange->plotrange,FrameTicks->{{yt,None},{xt,None}},Frame->True,Axes->False]

enter image description here

$\endgroup$
2
$\begingroup$

In Mathematica 12, you can use the new Around function inside ListLogLogPlot. No need for ErrorBarPlots any more.

toPlot = Map[({#[[1]], Around[#[[2]], #[[3]]]}) &, dataWithError];
ListLogLogPlot[toPlot, Joined -> True, Frame -> True]

$\endgroup$

Your Answer

By clicking “Post Your Answer”, you agree to our terms of service and acknowledge you have read our privacy policy.

Not the answer you're looking for? Browse other questions tagged or ask your own question.