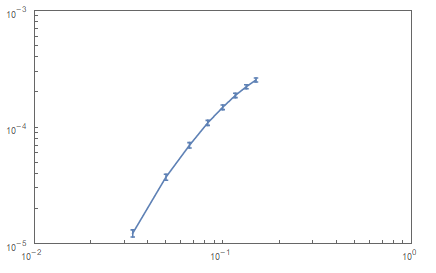
You can always perform coordinate transformation yourself. There is nothing so special about LogLogPlot. You have to apply Log to your points and plot it with regular ErrorListPlot. Keep in mind that your error bar won't be symmetric in log-log coordinates. After that you have to draw ticks according to your new scale.
This can be overkill for log-log case, but it gives you generic algorithm how to torture your axes any way you want.
Needs["ErrorBarPlots`"]
dataWithError = {{0.0333333, 0.0000122672, 0.00000173485}, {0.05, 0.0000371462,
                  0.00000448037}, {0.0666667, 0.0000697768, 0.00000748151},
                 {0.0833333, 0.000108625, 0.000010837}, {0.1, 0.000147595,
                  0.0000136051}, {0.116667, 0.000186599, 0.0000161483},
                 {0.133333, 0.000221451, 0.0000179078}, {0.15, 0.000253062, 0.0000192494}};

plotrange={Floor@Log10@Min[#],Ceiling@Log10@Max[#]}&@dataWithError[[All,#]]&/@{1,2};
logData={{Log10[#[[1]]],Log10[#[[2]]]},ErrorBar[Log10[1+0.5#]&/@{-#[[3]]/#[[2]],#[[3]]/#[[2]]} ] }&/@dataWithError;
xticks = {#,Superscript[10,#]}&/@Range[#1,#2,1]&@@plotrange[[1]];
yticks = {#,Superscript[10,#]}&/@Range[#1,#2,1]&@@plotrange[[2]];
{xt,yt}=#~Join~({#,""}&/@Flatten[(#[[1]]+Log10[{2,3,4,5,6,7,8,9}])&/@#])&/@{xticks,yticks};

 ErrorListPlot[logData, Joined -> True, PlotRange->plotrange,FrameTicks->{{yt,None},{xt,None}},Frame->True,Axes->False]

