I recently upgraded to Mathematica 10.2.0.0 for Linux (32-bit). In the past I have used the ErrorBarLogPlots package to put error bars on logarithmic plots of lists. When I make a simple ErrorListLogLogPlot, everything seems reasonable:
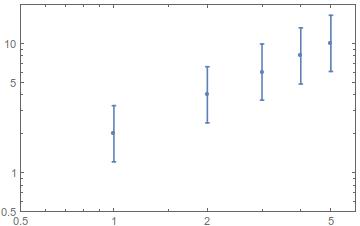
ErrorListLogLogPlot[Table[{{kk, 2*kk}, ErrorBar[kk]}, {kk, 1, 5}], PlotRange -> {{0.5, 6}, {0.5, 20}}, Axes -> False, Frame -> True]
produces:
When PlotMarkers are added,
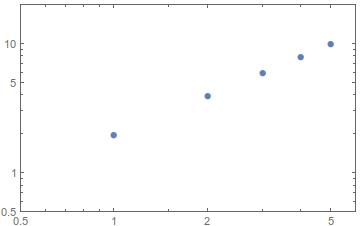
ErrorListLogLogPlot[Table[{{kk, 2*kk}, ErrorBar[kk]}, {kk, 1, 5}], PlotRange -> {{0.5, 6}, {0.5, 20}}, Axes -> False, Frame -> True, PlotMarkers -> Automatic]
the error bars disappear:
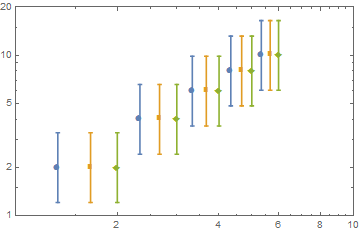
When Joined is True, the error bars return,
ErrorListLogLogPlot[Table[{{kk, 2*kk}, ErrorBar[kk]}, {kk, 1, 5}], PlotRange -> {{0.5, 6}, {0.5, 20}}, Axes -> False, Frame -> True, PlotMarkers -> Automatic, Joined -> True]
What am I doing wrong?


ErrorBarLogPlotspackage ... Look at the comments in that post, there seem to be a workaround usingMethod -> {"OptimizePlotMarkers" -> False}which "has to go before the PlotMarkers option for this to work" according to the user evanb. Maybe it will work in your case. $\endgroup$