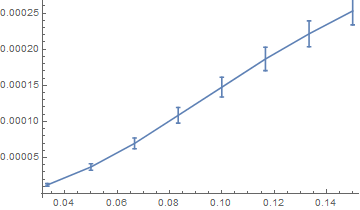
I have the following data consisting of x, y pairs and errors of y:
dataWithError = {{0.0333333, 0.0000122672, 0.00000173485}, {0.05, 0.0000371462,
                  0.00000448037}, {0.0666667, 0.0000697768, 0.00000748151},
                 {0.0833333, 0.000108625, 0.000010837}, {0.1, 0.000147595,
                  0.0000136051}, {0.116667, 0.000186599, 0.0000161483},
                 {0.133333, 0.000221451, 0.0000179078}, {0.15, 0.000253062, 0.0000192494}};
I can plot the data with error bars with:
ErrorListPlot[dataWithError, Joined -> True, PlotRange -> Full]
The result is:
I need a ListLogLogPlot with error bars (both axes have to be logarithmic). How can that be done?

