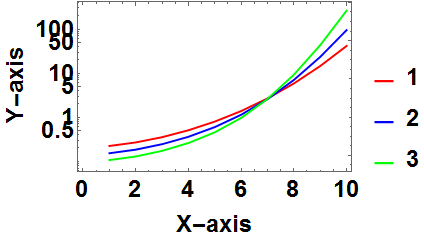
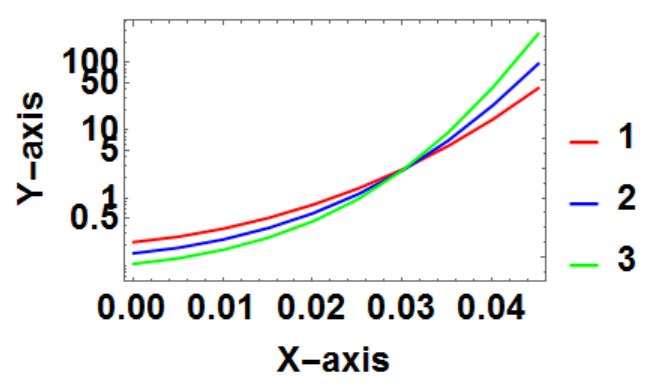
There must be a quick solution to this problem: How do you get the correct range for the X-axis. Attached below is the code:
{data1, data2, data3,
  data4} = {{0.0001, 0.0051, 0.0101, 0.0151, 0.0201, 0.0251, 0.0301,
   0.0351, 0.0401, 0.0451}, {0.223635, 0.268779, 0.353563, 0.508274,
   0.799853, 1.38739, 2.68267, 5.85528, 14.5708, 41.5504},
     {0.15296, 0.184358, 0.245081, 0.361329, 0.598999, 1.14273,
   2.57898, 7.04022, 23.4568, 95.0122}, {0.106818, 0.128991,
   0.172903, 0.260906, 0.456367, 0.967561, 2.61064, 9.26255, 43.3839,
   263.444}}

ListLogPlot[{data2, data3, data4}, Joined -> True,
 PlotStyle -> {{Red, Thickness[0.007]}, {Blue,
    Thickness[0.007]}, {Green, Thickness[0.007]}},
 LabelStyle -> Directive[Black, Bold, Large],
   FrameLabel -> {Style["X-axis", Large, Black],
   Style["Y-axis", Large, Black]}, Frame -> True,
 PlotLegends -> LineLegend[{1, 2, 3}]]
So instead of the shown (0 to 10) for the X-axis, I want the correct (0.0001 to 0.045). How can this be done?


DataRangeoption. $\endgroup$