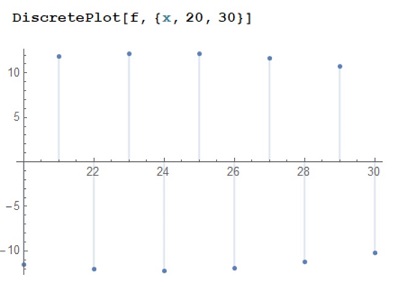
I use DiscretePlot for a function $f$ and the result is
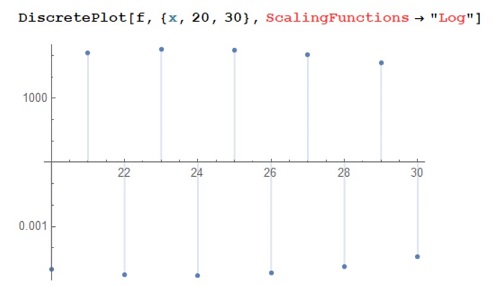
As I see, the range of the function includes negative values. Then, when I use ScalingFunctions -> "Log", I obtain
Here, the negative range of the function is given by positive values. Is this true?


Clear["`*"]; DiscretePlot[10 (-1)^n, {n, 0, 10}, ScalingFunctions -> "Log"]correctly displays the result of10for only the even values ofnsince for odd values ofntheLogis complex. Since your option is displayed in Red, it appears that it is not a valid option in your version. Was there some error message? $\endgroup$