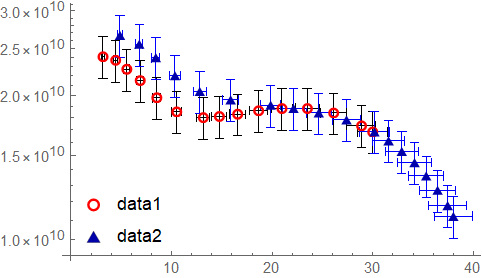
I have trouble with a ListLogPlot using data with error bars. I want to enhance the marker size since otherwise, the data points itself can not be identified very well.
Here comes the data:
data1 = {{Around[3.17, 0.1585], Around[2.41*^10, 2.41*^9]}, {Around[
4.43, 0.2215], Around[2.37*^10, 2.37*^9]}, {Around[5.54, 0.277],
Around[2.27*^10, 2.27*^9]}, {Around[6.87, 0.3435], Around[
2.15*^10, 2.15*^9]}, {Around[8.52, 0.426], Around[
1.98*^10, 1.98*^9]}, {Around[10.5, 0.525], Around[
1.85*^10, 1.85*^9]}, {Around[13.14, 0.657], Around[
1.8*^10, 1.8*^9]}, {Around[14.74, 0.7370000000000001], Around[
1.81*^10, 1.81*^9]}, {Around[16.56, 0.828], Around[
1.83*^10, 1.83*^9]}, {Around[18.64, 0.932], Around[
1.86*^10, 1.86*^9]}, {Around[20.96, 1.048], Around[
1.88*^10, 1.88*^9]}, {Around[23.49, 1.1744999999999999`], Around[
1.88*^10, 1.88*^9]}, {Around[26.1, 1.3050000000000002`], Around[
1.84*^10, 1.84*^9]}, {Around[28.87, 1.4435000000000002`], Around[
1.73*^10, 1.73*^9]}, {Around[29.98, 1.499], Around[
1.68*^10, 1.68*^9]}};
data2 = {{Around[4.86, 0.24300000000000002`], Around[
2.67*^10, 2.67*^9]}, {Around[6.78, 0.339], Around[
2.56*^10, 2.56*^9]}, {Around[8.42, 0.42100000000000004`], Around[
2.4*^10, 2.4*^9]}, {Around[10.33, 0.5165000000000001], Around[
2.2*^10, 2.2*^9]}, {Around[12.79, 0.6395], Around[
2.04*^10, 2.04*^9]}, {Around[15.86, 0.793], Around[
1.96*^10, 1.96*^9]}, {Around[19.84, 0.992], Around[
1.91*^10, 1.91*^9]}, {Around[22.11, 1.1055], Around[
1.88*^10, 1.88*^9]}, {Around[24.62, 1.231], Around[
1.84*^10, 1.84*^9]}, {Around[27.38, 1.369], Around[
1.78*^10, 1.78*^9]}, {Around[30.16, 1.508], Around[
1.68*^10, 1.68*^9]}, {Around[31.56, 1.578], Around[
1.61*^10, 1.61*^9]}, {Around[32.87, 1.6435], Around[
1.53*^10, 1.53*^9]}, {Around[34.14, 1.707], Around[
1.45*^10, 1.45*^9]}, {Around[35.3, 1.765], Around[
1.36*^10, 1.36*^9]}, {Around[36.43, 1.8215000000000001`], Around[
1.27*^10, 1.27*^9]}, {Around[37.43, 1.8715000000000002`], Around[
1.18*^10, 1.18*^9]}, {Around[38., 1.9000000000000001`], Around[
1.12*^10, 1.12*^9]}};
I played around a lot. But couldn't find a working solution. I don't want to use the Automatic option like this: PlotMarkers -> {Automatic, Medium} since I want to control marker style and marker color.
The best I could figure out was:
ListLogPlot[{data1, data2}, PlotMarkers -> {{\[FilledSmallCircle], 20},
{\[EmptyUpTriangle], 20}}, PlotStyle -> {Black, Blue},
PlotLegends -> Placed[{"data1", "data2"}, {{0.02, 0.02}, {0, 0}}]]
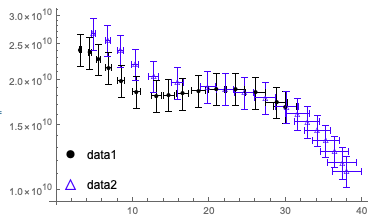
Resulting in a plot, where the marker size is changed in the legend, but not in the plot itself.
I look forward to your ideas. I can't believe, that there is no easy solution for such a problem, since I assume many people had it before.


PlotMarkers -> {{"\[FilledSmallCircle]", 20}, {"\[EmptyUpTriangle]", 20}}? $\endgroup$ListPlot. $\endgroup$PlotMarkers ->{{Style[\[FilledCircle], 20]}, {Style[\[EmptyUpTriangle], 20]}}$\endgroup$