40
$\begingroup$

I often want to plot two dimensional data that is centered around zero (for me, this is usually a 2D optical spectroscopy signal, but there are other cases), and the MATLAB "Jet" color scheme is ubiquitous in my field. I find this scheme to be horrendously ugly, and others have written at length at how bad it is for conveying information: see here, here, and here for just a sample. One of the main problems is that the perceptual changes in the color don't go at a uniform rate across the map. There are regions where the colors appear to change much faster, leading to the appearance of perceived bands. Nor does the luminosity follow any type of pattern, such that people with color deficiencies can have trouble reading the data.

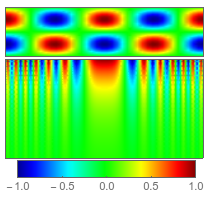
For showcasing data where there is a lot of zero-values and some positive and negative features, the Jet scheme results in a field of bright green, with positive and negative features shown in red and blue, all of which is oversaturated. Mathematica has done well to avoid this color map altogether, yet I have been called upon to use it on occasion so I took the trouble to import it from MATLAB.

The problem is highlighted by the following sample code (the first line imports a few custom color maps including Jet),

<< "http://pastebin.com/raw.php?i=sqYFdrkY";
showcolorfunction[color_] := 
  With[{opts = {PlotRange -> All, ColorFunction -> color, 
      PlotPoints -> 40, PlotRangePadding -> None, ImageSize -> 200}},
   Column[{
     DensityPlot[
      Cos[x] Sin[y], {x, -2 π, 2 π}, {y, -π, π}, 
      FrameTicks -> None, AspectRatio -> 1/4, opts],
     DensityPlot[
      10 Cos[x^2] Exp[y], {x, -2 π, 2 π}, {y, -π, 0}, 
      FrameTicks -> None, AspectRatio -> 1/2, opts], 
     DensityPlot[x, {x, -1, 1}, {y, 0, 1}, 
      FrameTicks -> {{None, None}, {Automatic, None}}, 
      AspectRatio -> 1/10, opts]}, Center, 0]
   ];
showcolorfunction@JetCM

enter image description here

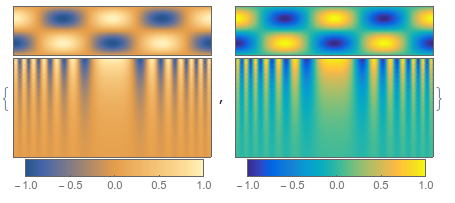
Mathematica's default color scheme (in version 10) whose name I don't know, is much better, as is MATLAB's new default scheme "Parula",

showcolorfunction /@ {Automatic, ParulaCM}

enter image description here

but neither of these does what I want here, which is to assign a "special" color to zero. What I would like is an implementation of Kenneth Moreland's diverging color maps. In his paper linked there, he describes a recipe for creating a continuous diverging color map starting from any two RGB colors, by converting to linear-RGB, then XYZ, then CIELAB, and finally into Msh, a polar-coordinate version of CIELAB.

On his page there are implementations of this recipe in VTK, python, MATLAB, and R - but nothing for Mathematica

$\endgroup$
10
  • $\begingroup$ To get you started look at RGBColor, LABColor (et al), Blend, ColorConvert. Maybe try to replicate the algorithm in the matlab code linked from the website. $\endgroup$ Commented Dec 9, 2015 at 14:31
  • $\begingroup$ "whose name I don't know" - "M10DefaultDensityGradient". $\endgroup$ Commented Dec 9, 2015 at 14:31
  • 3
    $\begingroup$ @J.M. - thank you. They really went out of their way to give it a catchy name, didn't they? $\endgroup$
    – Jason B.
    Commented Dec 9, 2015 at 14:41
  • 1
    $\begingroup$ @CATrevillian - I am pretty sure I asked the question at the time because I had already implemented my answer for a project I was working on at the time and wanted to share. Reading the question and looking at the accepted answer I would expect the 'special' color to be configurable, like an optional argument or option. But DivergentColorFunc just assumes the special value is white. (do I misunderstand your question?) $\endgroup$
    – Jason B.
    Commented Sep 19, 2023 at 22:28
  • 1
    $\begingroup$ Looking back, I would want DivergentColorFunc to allow me to specify an arbitrary color for zero, an arbitrary value for zero, and probably a scaling function. $\endgroup$
    – Jason B.
    Commented Sep 19, 2023 at 22:32

2 Answers 2

49
$\begingroup$

I've taken the liberty of converting the pseudocode from Moreland's paper into a package. I had to change the numerical values of the RGB->XYZ transformation matrix to account for the fact that Mathematica uses different reference white points for the different color spaces.

Update This function is available in the function repository, and the source code is available on github. Much thanks to J.M., I've changed a few functions around to make them simpler - but I have kept all the color conversion functions because I like them for clarity, and they don't slow it down compared to the built-in ColorConvert function.

BeginPackage["DivergentColorMaps`"]

DivergentColorFunc::usage = "DivergentColorFunc[{r1,g1,b1},{r2,b2,g2}] returns a continuously diverging color map which interpolates between two RGB colors.\n
DivergentColorFunc[color1, color2] takes two color objecst as input and returns a continuously diverging color map."
CoolToWarm::usage = "Cool2Warm[n] gives the cool to warm color map, with n taking values between 0 and 1"
DivergentColorScheme::usage = "DivergentColorScheme[scheme] gives a diverging color map which interpolates between the starting and ending colors in a builtin scheme"
DivergentMaps::usage = "DivergentMaps is list of four divergent color maps used in http://www.kennethmoreland.com/color-maps/ColorMapsExpanded.pdf . divergentMaps[[1]] is equivalent to Cool2Warm" 

Begin["`Private`"]


(* 
The reference white values and transformation matrix correspond to the 
fact that in Mathematica, the RGB white point uses the D65 standard, 
while the XYZ and LAB color spaces use the D50 white point.  This is 
different than in Moreland's paper or other color conversion websites 
*)

referenceWhite = {96.42, 100.0, 82.49};


transformation = {{0.436075, 0.385065, 0.14308}, 
   {0.222504, 0.716879, 0.0606169},
   {0.0139322, 0.0971045, 0.714173}};

(*Forward Transformations*)

rgb2xyz[r_, g_, b_] := Module[
   {transm, rl, gl, bl},
   {rl, gl, bl} = If[# > .04045,
       ((# + 0.055)/1.055)^2.4,
       #/12.92] & /@ {r, g, b};
   transm = transformation;
   100 transm.{rl, gl, bl}
   ];

xyz2lab[xi_, yi_, zi_] := Module[{f, refx, refy, refz, x, y, z},
   {refx, refy, refz} = referenceWhite;
   f = If[((#) > 0.008856),
      (#^(1/3)),
      (7.787 # + 4/29.)] &;
   {x, y, z} = f /@ ({xi, yi, zi}/{refx, refy, refz});
   {116.0 (y - 4./29), 500.0 (x - y), 200 (y - z)}
   ];

lab2msh[l_, a_, b_] := Module[{m = Norm[{l, a, b}]}, {m, 
   If[m==0, 0, ArcCos[l/m]], Arg[a + b I]}];
rgb2msh[r_, g_, b_] := lab2msh @@ xyz2lab @@ rgb2xyz @@ {r, g, b};

(* Backward Transformations *)

msh2lab[m_, s_, h_] := {m Cos[s], m Sin[s] Cos[h], m Sin[s] Sin[h]};

lab2xyz[l_, a_, b_] := Module[{x, y, z, refx, refy, refz},
   {refx, refy, refz} = referenceWhite;
   y = (l + 16)/116.;
   x = a/500. + y;
   z = y - b/200.;
   {x, y, z} = 
    If[#^3 > 0.008856, #^3, (# - 4./29)/7.787] & /@ {x, y, z};
   {x, y, z} {refx, refy, refz}
   ];

xyz2rgb[x_, y_, z_] := Module[{transm, r, g, b},
   transm = Inverse@transformation;
   {r, g, b} = {x, y, z}/100;
   {r, g, b} = transm.{r, g, b};
   If[# > 0.0031308, 1.055 #^(1/2.4) - 0.055, 12.92 #] & /@ {r, g, b}
   ];

msh2rgb[m_, s_, h_] := xyz2rgb @@ lab2xyz @@ msh2lab @@ {m, s, h};

adjusthue[msat_, ssat_, hsat_, munsat_] := Module[{hspin},
   If[msat >= munsat,
    hsat,
    hspin = ssat Sqrt[munsat^2 - msat^2]/(msat Sin[ssat]);
    If[hsat > -\[Pi]/3,
     hsat + hspin,
     hsat - hspin
     ]
    ]
   ];


interpolatecolor[rgb1_List, rgb2_List, interp_?NumericQ] := 
  Module[
   {m1, s1, h1, m2, s2, h2, interpvar, mmid, smid, hmid},
   (*If points are saturated and distinct, 
   place white in the middle *)
   {m1, s1, h1} = 
    rgb2msh @@ rgb1;
   {m2, s2, h2} = rgb2msh @@ rgb2;
   interpvar = interp;
   If[s1 > 0.05 && s2 > 0.05 && Abs[h1 - h2] > Pi/3,
    mmid = Max@{m1, m2, 88.};
    If[interp < 1/2,
     {m2, s2, h2, interpvar} = {mmid, 0, 0, 2 interp};,
     {m1, s1, h1, interpvar} = {mmid, 0, 0, 2 interp - 1};
     ];
    ];
   (* Adjust hue of unsaturated colors *)

   Which[s1 < 0.05 && s2 > 0.05,
    h1 = adjusthue[m2, s2, h2, m1];,
    s2 < 0.05 && s1 > 0.05,
    h2 = adjusthue[m1, s1, h1, m2];
    ];
   {mmid, smid, hmid} = (1 - interpvar) {m1, s1, h1} + 
     interpvar {m2, s2, h2};
   msh2rgb @@ {mmid, smid, hmid}

   ];

DivergentColorFunc[rgb1_, rgb2_] := 
  With[{interp = RGBColor @@@ Chop @ (interpolatecolor[rgb1, rgb2, #] &/@ Range[0,1,.05])},
      Blend[interp, #] & ];


DivergentColorFunc[col1_?ColorQ, col2_?ColorQ] := DivergentColorFunc @@ List @@@ (ColorConvert[{col1, col2}, RGBColor]) ;

DivergentColorScheme[scheme_String] := 
  DivergentColorFunc @@ ColorData[scheme] /@ {0, 1};


CoolToWarm = DivergentColorFunc[{0.23, 0.299, 0.754}, {0.706, 0.016, 0.150}];


DivergentMaps = 
  DivergentColorFunc[#1, #2] & @@@ {{{0.23, 0.299, 0.754}, {0.706, 
      0.016, 0.150}},
    {{0.436, 0.308, 0.631}, {0.759, 0.334, 0.046}}, {{0.085, 0.532, 
      0.201}, {0.436, 0.308, 0.631}}, {{0.217, 0.525, 0.910}, {0.677, 
      0.492, 0.093}}, {{0.085, 0.532, 0.201}, {0.758, 0.214, 0.233}}};

End[]
EndPackage[]

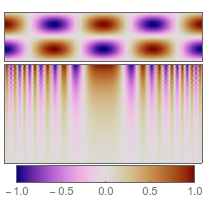
Now I can create a continuous divergent color map simply from two RGB colors,

newcolorfunc = DivergentColorFunc[{0, 0, .5}, {.5, 0, 0}];
showcolorfunction@newcolorfunc
enter image description here

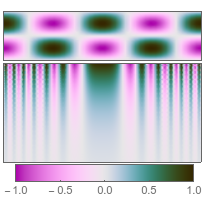
Or, taking inspiration from the way J.M.'s function is defined, you can give color objects as the arguments - in any color space,

newcolorfunc2 = 
  DivergentColorFunc[Darker[XYZColor[1, 0.2, 1]], 
   LUVColor[.16, .5, 1]];
showcolorfunction@newcolorfunc2
enter image description here

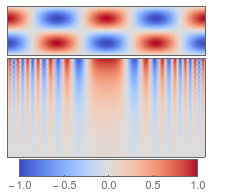
I can use the cool2warm color scheme Moreland recommends,

showcolorfunction@CoolToWarm
enter image description here

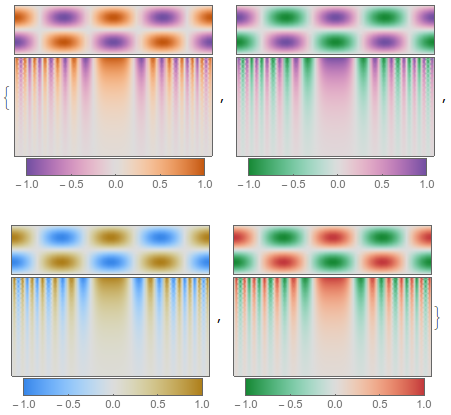
or the other four examples listed at the bottom of his page

showcolorfunction /@ DivergentMaps[[2 ;;]]
enter image description here

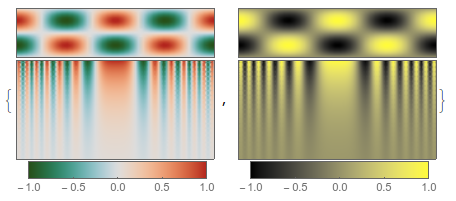
I even have a function that will take a named color scheme, extract the two outer colors, and build a divergent scheme from them.

showcolorfunction /@ (DivergentColorScheme /@ {"RoseColors", "AvocadoColors"})
enter image description here

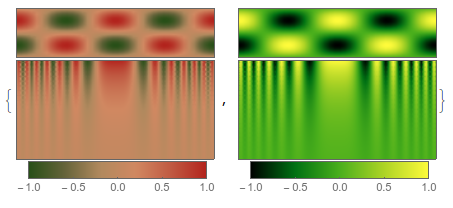
Just for comparison, here are those color schemes without the divergent function,

showcolorfunction /@ ({"RoseColors", "AvocadoColors"})
enter image description here

$\endgroup$
23
  • 2
    $\begingroup$ One comment though: it is really better to capitalize symbol names in package to ensure that user-symbols (which should not be capitalized) won't conflict with them. $\endgroup$
    – Szabolcs
    Commented Dec 10, 2015 at 14:20
  • 3
    $\begingroup$ @szabolcs what about possible colisions with future releases of mma? $\endgroup$
    – Kuba
    Commented Dec 10, 2015 at 22:55
  • 2
    $\begingroup$ @Kuba That's a much smaller problem that collisions with user symbols. New releases happen rarely. When they do, some breakage is expected. The package author should test the package with each new release and fix any problems. The difference between a package and code typed during an interactive session is that a package is written with care. I put in significant effort to write the package once, then I (or possibly many other people) will use it many times. Given all that effort, it's not much more to ask to try to choose names that are less likely to conflict with builtins ... $\endgroup$
    – Szabolcs
    Commented Dec 11, 2015 at 7:15
  • 2
    $\begingroup$ This documentation page contains the most relevant thing I could find in the docs: "There is a convention that built‐in Wolfram Language objects always have names starting with uppercase (capital) letters. To avoid confusion, you should always choose names for your own variables that start with lowercase letters." $\endgroup$ Commented Dec 14, 2015 at 15:57
  • 2
    $\begingroup$ To say which color map is best for plotting on anatomical structures, I'm not really sure. When the data is all the same sign, then I like the Parula color map, but the default color function for DensityPlot is also very nice. But if the data is equally spaced around some mean value, then I like to use a divergent color map. Also, you should read the original paper that this post is inspired by, Diverging Color Maps for Scientific Visualization (Expanded) $\endgroup$
    – Jason B.
    Commented Sep 22, 2016 at 14:26
24
$\begingroup$

Here's my take (using some of the new version 10 functions):

adjusthue[msat_, ssat_, hsat_, munsat_] := hsat +
      (1 - 2 UnitStep[-hsat - π/3]) If[munsat == msat, 0., 
      Sqrt[Max[1, munsat/(msat + $MachineEpsilon)]^2 - 1]/Sinc[ssat]]

l2m = With[{m = Norm[{##}]}, {m, ArcCos[If[m == 0, 0, #1/m]], Arg[#2 + I #3]}] &;
m2l = #1 Prepend[Sin[#2] Through[{Cos, Sin}[#3]], Cos[#2]] &;

SetAttributes[interpolatecolor, Listable]; 
interpolatecolor[col1_?ColorQ, col2_?ColorQ, interp_?NumericQ] := 
     Module[{ m1, s1, h1, m2, s2, h2, mmid, t},

            {m1, s1, h1} = l2m @@ ColorConvert[col1, LABColor];
            {m2, s2, h2} = l2m @@ ColorConvert[col2, LABColor];

            t = interp;
            If[Min[s1, s2] > 0.05 && Abs[h1 - h2] > π/3,
               mmid = Max[m1, m2, 0.88];
               If[t < 1/2,
                  {m2, s2, h2, t} = {mmid, 0., 0., 2 t},
                  {m1, s1, h1, t} = {mmid, 0., 0., 2 t - 1}]];

            Which[s1 < 0.05 && s2 > 0.05, h1 = adjusthue[m2, s2, h2, m1],
                  s2 < 0.05 && s1 > 0.05, h2 = adjusthue[m1, s1, h1, m2]];

            ColorConvert[m2l @@ ({1 - t, t}.{{m1, s1, h1}, {m2, s2, h2}}),
                         LABColor -> RGBColor]]

divergentColorGradient[col1_?ColorQ, col2_?ColorQ, res_Integer: 20] := 
         With[{cl = interpolatecolor[col1, col2, Subdivide[res]]}, Blend[cl, #] &]

(N.B. the previous version of this answer used the built-in coordinate conversion functions, but they were too slow for this application. The handling for Black in adjusthue[] through a tiny perturbation is still hackish IMHO, but at least it's compact.)

Test:

cool2warm = divergentColorGradient[RGBColor[59/255, 76/255, 64/85],
                                   RGBColor[12/17, 4/255, 38/255]];

LinearGradientImage[cool2warm, {300, 30}]

cool2warm gradient

$\endgroup$
2
  • $\begingroup$ This is great! I'm partial to the handcoded functions, since I can see what is going on, but that is just personal taste. Your version is much more compact, but mine seems to generate a color function a bit faster (not that speed is all that important in this case). $\endgroup$
    – Jason B.
    Commented Dec 10, 2015 at 10:15
  • $\begingroup$ Yes, the slowdown is apparently due to the built-in coordinate change functions; replacing them with the explicit formulae for Cartesian-spherical (that is, Lab-Msh) conversion speeds the function up considerably. At the moment, I'm looking into a less hack-ish way to handle Black; I'll update this post if I figure something out. $\endgroup$ Commented Dec 10, 2015 at 14:19

Your Answer

By clicking “Post Your Answer”, you agree to our terms of service and acknowledge you have read our privacy policy.

Not the answer you're looking for? Browse other questions tagged or ask your own question.