Your question addresses PlotTheme.
This is how default PlotTheme looks:
Plot[Evaluate[Table[BesselJ[n, x], {n, 5}]], {x, 0, 10}]
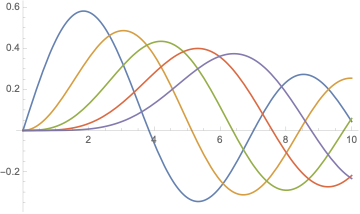
It is "PastelColor". No Plot without PlotTheme.
Very much contrasting is:
Plot[Evaluate[Table[BesselJ[n, x], {n, 5}]], {x, 0, 10},
 PlotTheme -> "GrayColor"]

Plot[Evaluate[Table[BesselJ[n, x], {n, 5}]], {x, 0, 10},
 PlotTheme -> "CoolColor"]
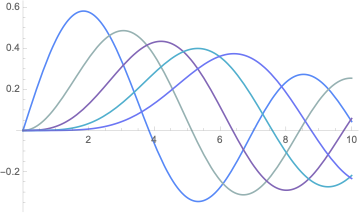
Like in the question the options can be overwritten and replace in putting them explicit in the options list and give them the desired value.
Your question addresses too PlotStyle. Then a solution will be
Plot[Evaluate@Table[BesselJ[n, x], {n, 3}], {x, 0, 15},
 PlotStyle -> {Darker@Orange, Orange, Lighter@Orange}]
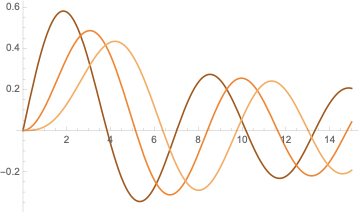 But that there only three lightnesses built in.
Plot[Evaluate@Table[BesselJ[n, x], {n, 5}], {x, 0, 15},
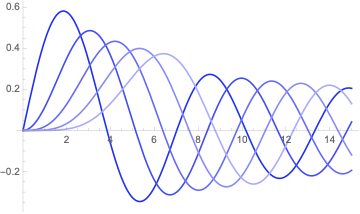
 PlotStyle -> Table[Darker[Blue, i/5], {i, 1, 5}]]
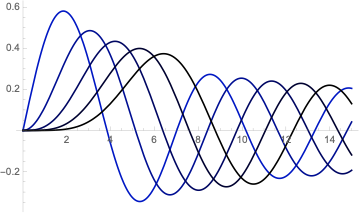 This in not so high in contrast but step in
 Darker of the color Blue.
Same with Lighter:
Plot[Evaluate@Table[BesselJ[n, x], {n, 5}], {x, 0, 15},
 PlotStyle -> Table[Lighter[Blue, i/7.5], {i, 1, 5}]]
 Mathematica knows since 12 a lot of important colors:
 Color.
Plot[Evaluate@Table[BesselJ[n, x], {n, 5}], {x, 0, 15},
 PlotStyle ->
  Table[Lighter[Interpreter["Color"]["HTML green"], i/7.5], {i, 1,
    5}], AxesStyle -> {Thick, 18}, PlotRange -> Full]
![Interpreter["Color"]["HTML green"]](https://i.sstatic.net/Jhyo4.png) You may use
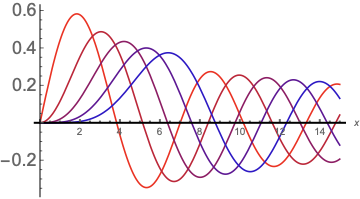
You may use Blend:
Plot[Evaluate@Table[BesselJ[n, x], {n, 5}], {x, 0, 15},
 PlotStyle -> Table[Blend[{Red, Blue}, x], {x, 0, 1, 1/5}],
 AxesStyle -> {Thick, 18}, PlotRange -> Full, AxesLabel -> Automatic]
 References on
 Blend spend ideas for many more possibilities.



![Interpreter["Color"]["HTML green"]](https://i.sstatic.net/Jhyo4.png)
