2
$\begingroup$

I am stuck on figuring out how to do a "Temperature" Color scheme for a surface plotted using ParametricPlot3D. As an example, here is a plot of one example surface. enter image description here
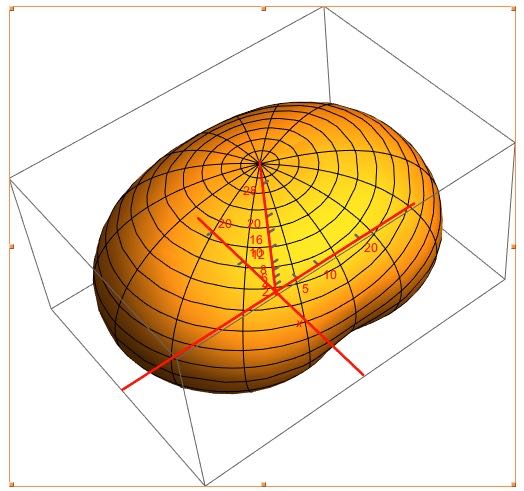
This is a antenna gain plot of a dipole antenna. The numeric information is generated by a program and the actual gain data (surface) runs from -25 dB to about 7 dB (in this plot). Since all radial vectors I used in the plot needed to be positive, I scaled the plot by adding 25 dB to all data points so the data runs from about 0 to 32 dB where 25 dB is the zero dB point.

I want to color the surface like a Temperature Map color function where about -6 dB is the cross over from cool colors (which I think of as blues though I know they are higher temperature) to warm colors and reds indicating the highest gain figures. Thus, -6 dB (or, numerically on the plot, 19 dB) is where the colors start changing from blues to yellows to reds with blues on more negative gain values.

It seems to be a rather normal and easy to do thing but I am missing out on how I use the gain figures in with the color function to scale the colors per gain on the plot.

Ignore the red coordinate axes lines as I only put that there to double-check which axes is the x-axis in the plot.

MODIFICATIONS DUE TO POSTED ANSWER:

I have used information derived from a posted answer to update my plot but I am not getting the results that I expect.

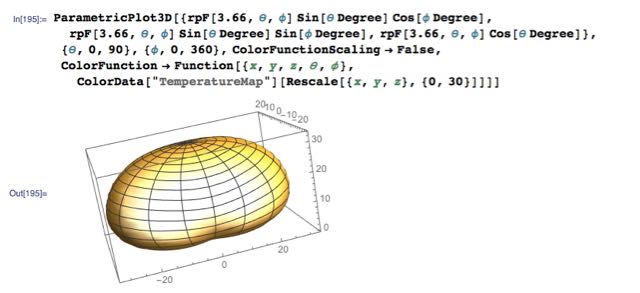
Here is my plotting command and results:

enter image description here

The function rpF[$f$,$\theta$,$\phi$] is an Interpolation function that is dependent on frequency, theta, and phi. Theta and Phi are the spherical coordinate coordinates (theta of zero is in Z-direction). The value returned from rpF is the gain for the antenna for coordinates theta and phi.

I actually do not understand how the color function works and how the variables I specified (e.g. x, y, z) associate with color data. I have read the documentation but I have not found where this is described to such a neophyte as myself.

$\endgroup$

1 Answer 1

4
$\begingroup$

You will want to set the automatic rescaling of the data passed to ColorFunction, then write your own ColorFunction that appropriately rescales the data so that a $z$ value of 25 is translated to an input of $0.5$ to the TemperatureMap color function:

ParametricPlot3D[
  yourFunction, yourParamValues,
  ColorFunctionScaling -> False,
  ColorFunction -> 
    Function[
     {x, y, z, u, v},
     ColorData["TemperatureMap"][Rescale[z, {0, 32}]]
    ]
]

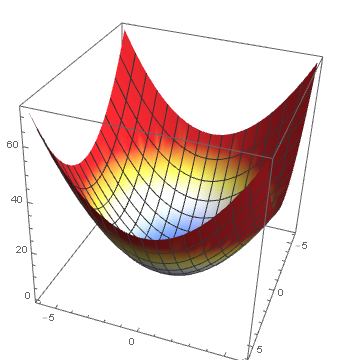
Here is an example with a somewhat random function:

ParametricPlot3D[
 {u, v, u^2 + v^2}, {u, -6, 6}, {v, -6, 6}, 
 BoxRatios -> {1, 1, 1},
 ColorFunctionScaling -> False,
 ColorFunction ->
   Function[
     {x, y, z, u, v},
     ColorData["TemperatureMap"][Rescale[z, {0, 32}]]
   ]
]

Mathematica graphics

$\endgroup$
5
  • $\begingroup$ (+1) you could also use ColorFunction -> ColorData[{"TemperatureMap", {0, 32}}]. $\endgroup$
    – kglr
    May 30, 2016 at 2:07
  • $\begingroup$ @MarcoB I have updated my question with further plotting work and have included my actual ParametricPlot3D function call with description of my function. Still not getting desired results after incorporating your suggestions as best I can figure that they apply to my plot. $\endgroup$
    – K7PEH
    May 30, 2016 at 4:43
  • $\begingroup$ @K7PEH Replace the Rescale[{x, y, z}] in your updated code with a simple Rescale[z] as shown in my answer, and let me know if it's any better. $\endgroup$
    – MarcoB
    May 30, 2016 at 5:54
  • $\begingroup$ @MarcoB I first tried the Rescale with the z variable only and it did produce a temperature map but only along the z axis. The actual maximum gain figures do not follow the Z axis at all. In fact, maximum gain appears right around the 51 degree position (theta angle where 0 is Z-axis) which is in the lower portion of the plotted gain diagram. And, this is actually as it should be for this is a fairly descent defined 80-meter dipole antenna at the right elevation above ground to create such a "take-off" angle (as it is called by ham radio operators). $\endgroup$
    – K7PEH
    May 30, 2016 at 14:54
  • $\begingroup$ Oh, for clarification, the value 3.66 specified as the frequency argument to the rpm[] function is the resonant frequency of the antenna. It is not perfect resonance though, the SWR (standing wave ratio) of about 1.75:1 and there is a small amount of capacitive reactance for the input impedance. $\endgroup$
    – K7PEH
    May 30, 2016 at 15:05

Your Answer

By clicking “Post Your Answer”, you agree to our terms of service and acknowledge you have read our privacy policy.

Not the answer you're looking for? Browse other questions tagged or ask your own question.