1
$\begingroup$

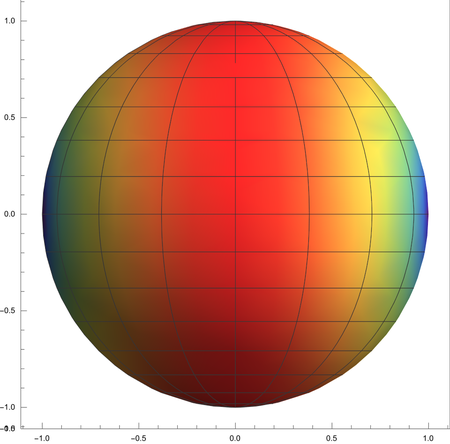
I am trying to plot a density plot on a surface of a sphere, where the density function Sqrt[1-x^2] is symmetric around 0. (There, x=Sin[θ] Cos[ϕ]).

So far I have:

ParametricPlot3D[{Sin[θ] Cos[ϕ], 
Sin[θ] Sin[ϕ], Cos[θ]}, {θ, 0, π}, {ϕ, 0, 2 π}, ColorFunction -> Function[{x, y, z, θ, ϕ}, ColorData["Rainbow"][Sqrt[1 - x^2]]]]

But somehow when the plot is displayed, the colors at x=1 and x=-1 do not match. Does it have something to do with the ColorFunction?

$\endgroup$

1 Answer 1

4
$\begingroup$
ColorFunctionScaling -> False
ParametricPlot3D[{Sin[θ] Cos[ϕ], 
  Sin[θ] Sin[ϕ], Cos[θ]}, {θ, 
  0, π}, {ϕ, 0, 2 π}, 
 ColorFunction -> 
  Function[{x, y, z, θ, ϕ}, 
   ColorData["Rainbow"][Sqrt[1 - x^2]]], 
 ColorFunctionScaling -> False]

enter image description here

$\endgroup$
0

Your Answer

By clicking “Post Your Answer”, you agree to our terms of service and acknowledge you have read our privacy policy.

Not the answer you're looking for? Browse other questions tagged or ask your own question.