I have this DATA points:
{{0., 0., 0.117237}, {0.125, 0.0721688, 0.0185109}, {0.125, 0.216506,
  0.08128}, {0.25, 0., 0.08128}, {0.25, 0.288675, 0.0215464}, {0.25,
  0.433013, 0.0978551}, {0.375, 0.0721688, 0.0215464}, {0.375,
  0.216506, 0.0796793}, {0.375, 0.505181, 0.0215464}, {0.375,
  0.649519, 0.08128}, {0.5, 0., 0.0978551}, {0.5, 0.433013,
  0.0796793}, {0.5, 0.721688, 0.0185109}, {0.5, 0.866025,
  0.117237}, {0.625, 0.0721688, 0.0215464}, {0.625, 0.216506,
  0.0796793}, {0.625, 0.505181, 0.0215464}, {0.625, 0.649519,
  0.08128}, {0.75, 0., 0.08128}, {0.75, 0.288675, 0.0215464}, {0.75,
  0.433013, 0.0978551}, {0.875, 0.0721688, 0.0185109}, {0.875,
  0.216506, 0.08128}, {1., 0., 0.117237}}
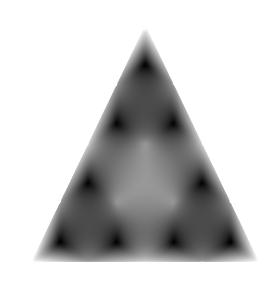
that I want to make a density plot. Using high orders of Interpolation does not give an accurated result. I'm trying to do something like this
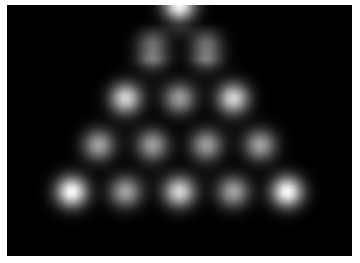
I've tried to use ListDensityPlot and change the parameters InterpolationOrder -> 1 and MaxPlotPoints -> 100. The result is as follows
As you may notice the result is not exactly the same, but I wish reach the same aspects, with all black around the triangle.


