3
$\begingroup$

I did go through Density plot on the surface of sphere where great examples are provided. What I am very much interested is in plotting spherical harmonics (real/imaginary or lets say just the assoc. Legendre Polynomials) on a 2-sphere (of unit radius) but just using two primary colors, say blue and red. I would like to use red when the value of the function goes to zero and blue when it peaks (to whatever it peaks) and a nice combination of these two somewhere in the middle. Is that possible? Rainbow doesn't help at all in visualizing. Have spent a lot of time but with no results! Any help would be highly appreciated.

I used

SphericalPlot3D[1, {θ, 0, π}, {Φ, 0, 2 π}, 
     ColorFunction -> Function[{x, y, z, θ, Φ, r}, 
         ColorData["Rainbow"][Re@SphericalHarmonicY[1,0,θ,Φ]]], 
     ColorFunctionScaling -> False, Mesh -> False, Boxed -> False, Axes -> False]
$\endgroup$
4
  • $\begingroup$ Show your code. If you just want two colors use Blend $\endgroup$
    – Bob Hanlon
    Commented Apr 9, 2021 at 16:27
  • $\begingroup$ Thanks for the suggestion, I added the code, but where do I add Blend? $\endgroup$ Commented Apr 9, 2021 at 16:40
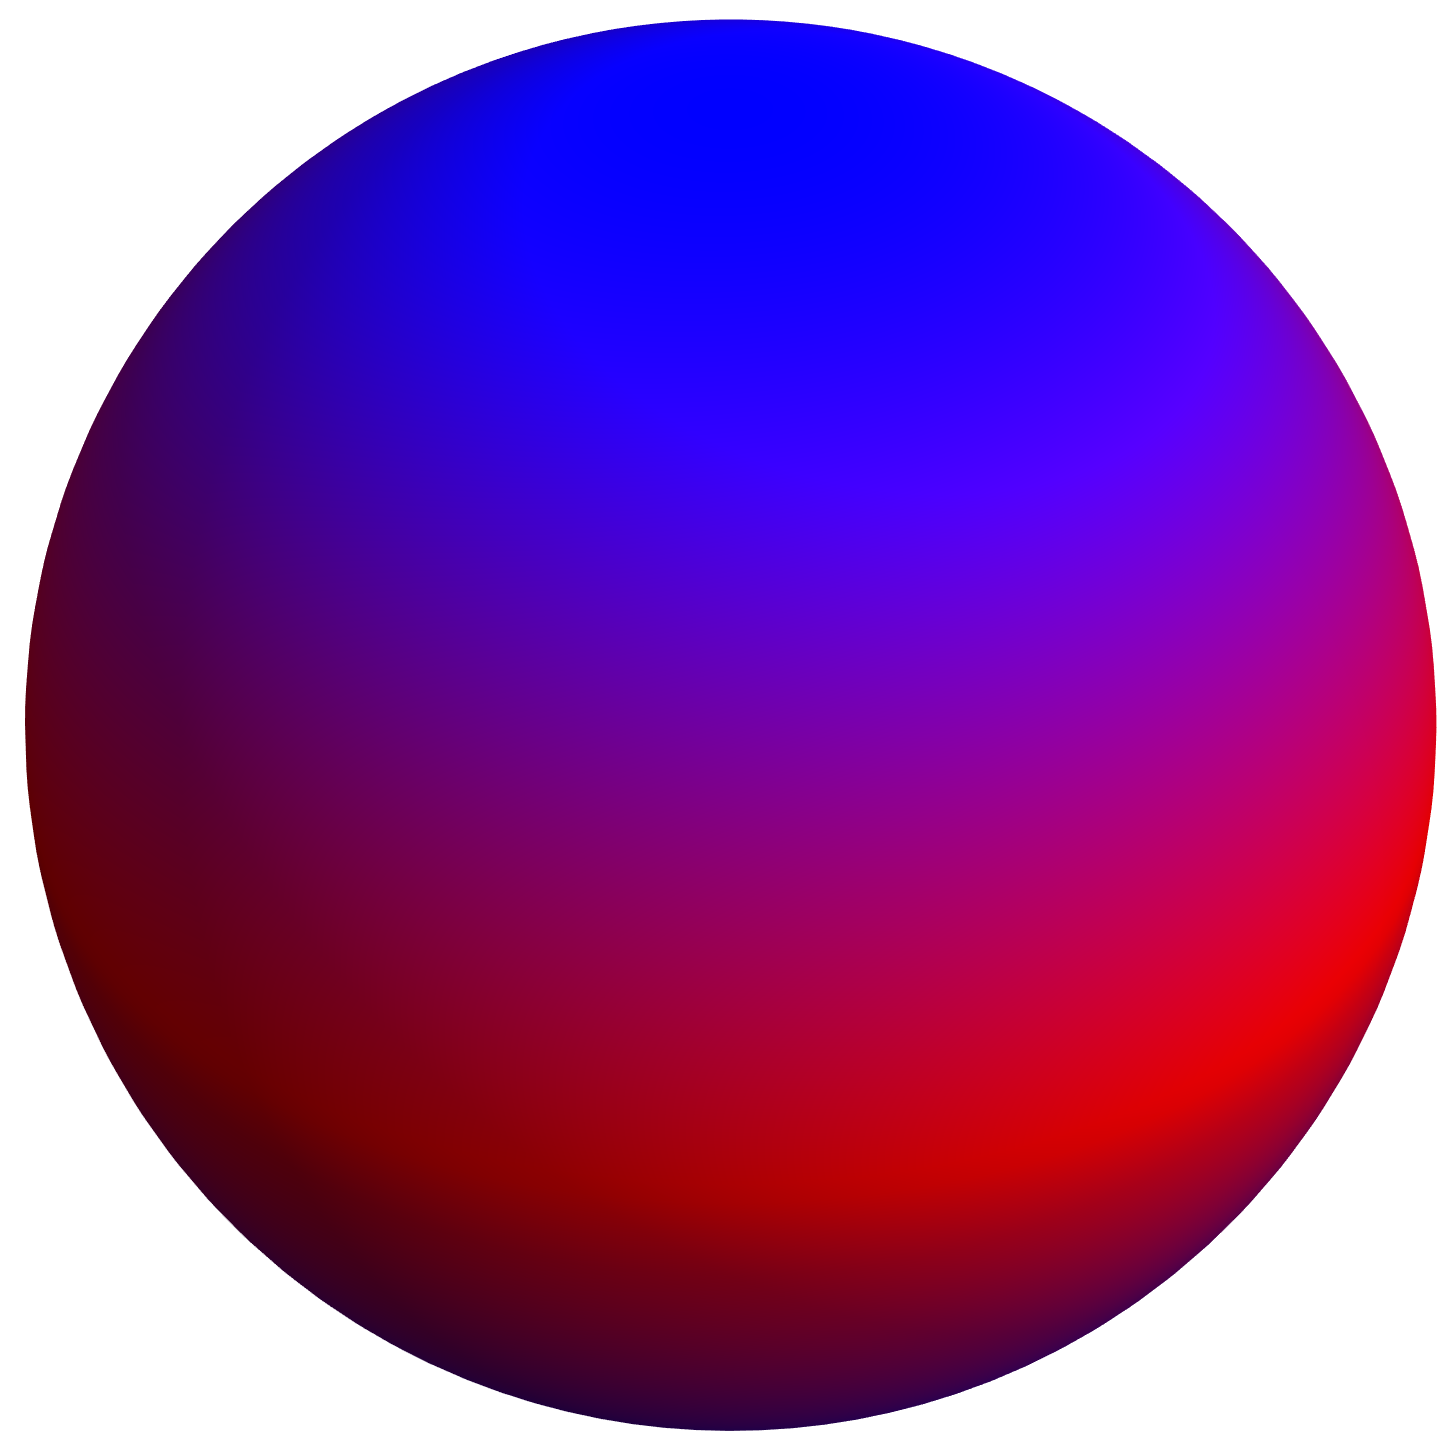
  • $\begingroup$ SphericalPlot3D[1, {\[Theta], 0, \[Pi]}, {\[CapitalPhi], 0, 2 \[Pi]}, ColorFunction -> Function[{x, y, z, \[Theta], \[CapitalPhi], r}, Blend[{Red, Blue}, Re@SphericalHarmonicY[1, 0, \[Theta], \[CapitalPhi]]]], PlotPoints -> 100, ColorFunctionScaling -> False, Mesh -> False, Boxed -> False, Axes -> False] $\endgroup$
    – Bob Hanlon
    Commented Apr 9, 2021 at 16:58
  • $\begingroup$ Great, thank you so much @BobHanlon . Is there a way to make the Blend function understand that 0 is where I want the red, and want blue both for $\theta$ = 0 and $\pi$ (for $\ell=1,m=0$). $\endgroup$ Commented Apr 9, 2021 at 17:27

1 Answer 1

3
$\begingroup$
Clear["Global`*"]

SphericalHarmonicY[1, 0 , θ, Φ] is real for real {θ, Φ}

FunctionDomain[
 SphericalHarmonicY[1, 0, θ, Φ], {θ, Φ}]

(* True *)

The min and max values are

{min, max} = #[{Re@SphericalHarmonicY[1, 0, θ, Φ], 
     0 <= θ <= Pi, 
     0 <= Φ <= 2 Pi}, {θ, Φ}] & /@ {MinValue, 
   MaxValue}

(* {-(Sqrt[(3/π)]/2), Sqrt[3/π]/2} *)

For Red for zero and Blue at both of the extremes:

SphericalPlot3D[1, {θ, 0, π}, {Φ, 0, 2 π},
 ColorFunction -> Function[{x, y, z, θ, Φ, r},
   Blend[{Blue, Red, Blue},
    Rescale[SphericalHarmonicY[1, 0, θ, Φ], {min, max}]]],
 PlotPoints -> 100,
 ColorFunctionScaling -> False,
 Mesh -> False,
 Boxed -> False,
 Axes -> False]
enter image description here

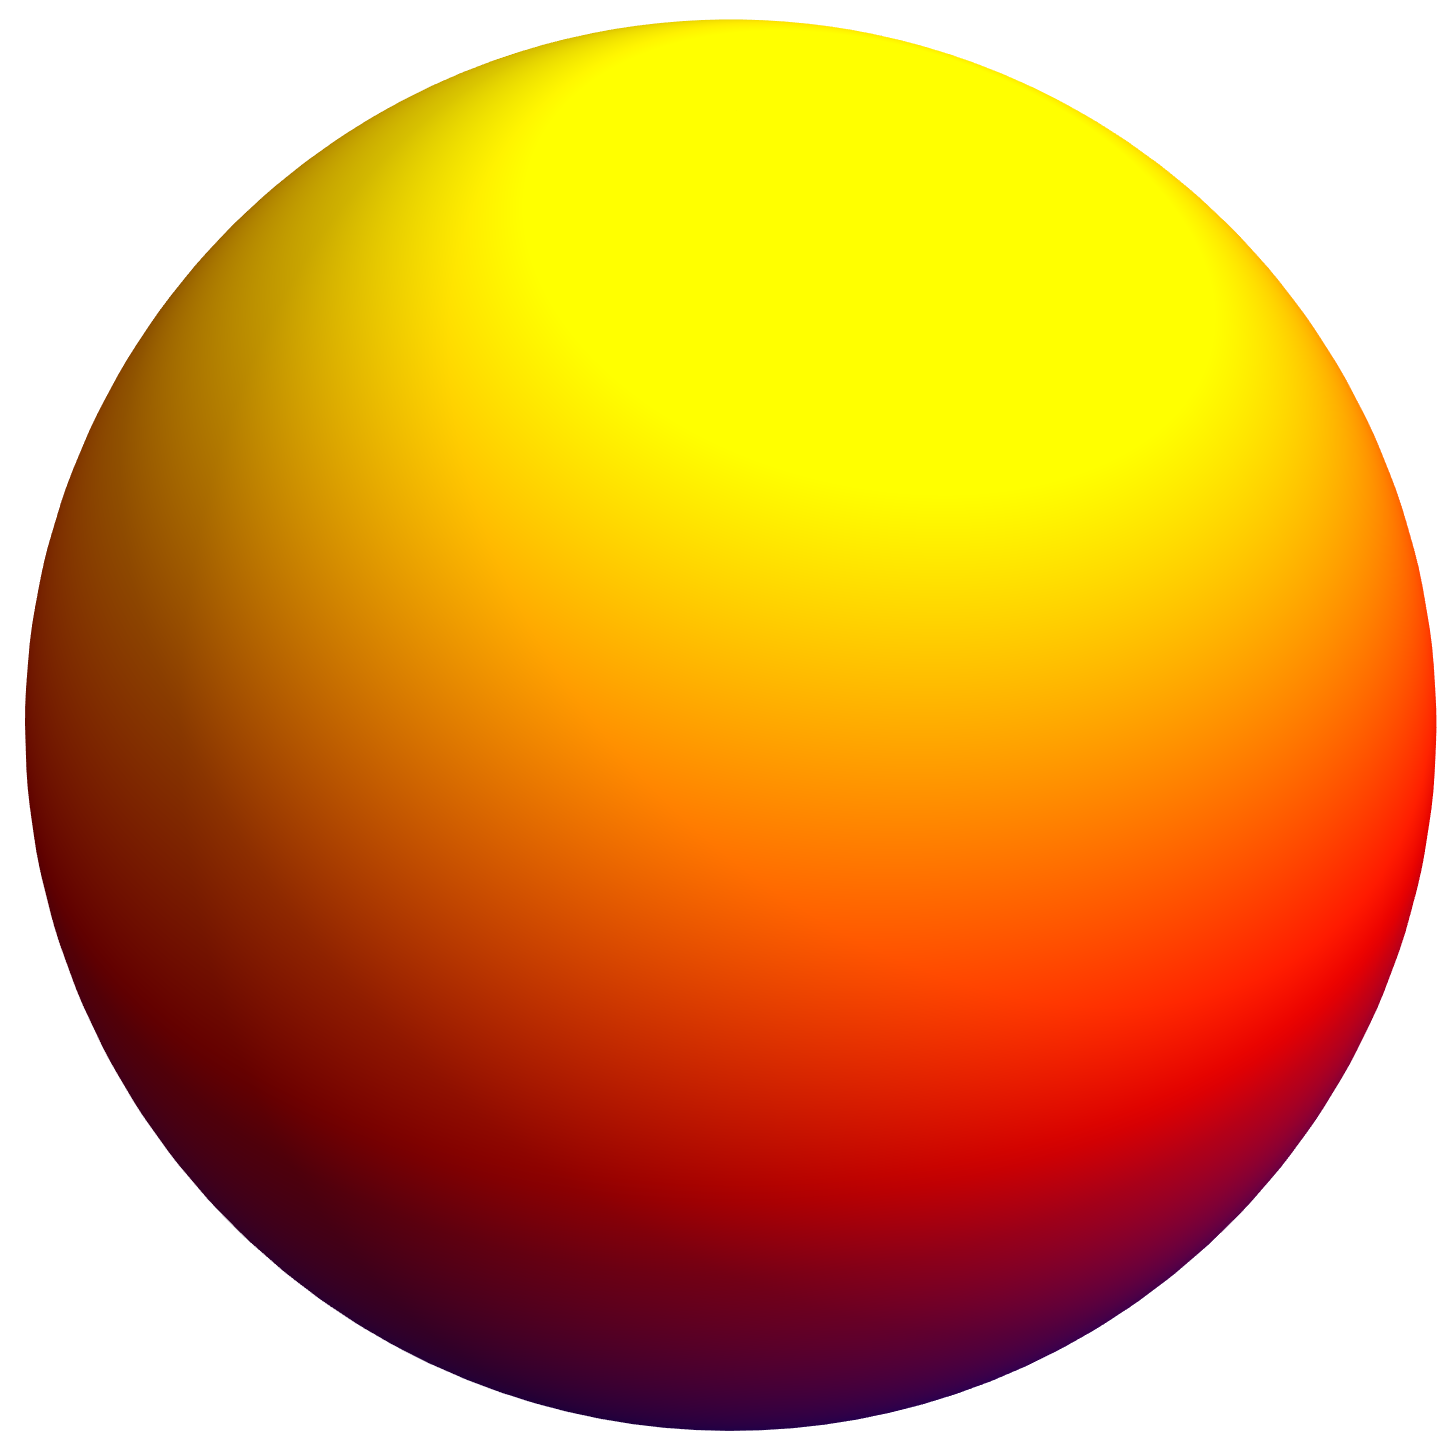
For Blue at negative extreme, Red at zero, and Yellow at positive extreme:

SphericalPlot3D[1, {θ, 0, π}, {Φ, 0, 2 π},
 ColorFunction -> Function[{x, y, z, θ, Φ, r},
   Blend[{Blue, Red, Yellow},
    Rescale[SphericalHarmonicY[1, 0, θ, Φ], {min, max}]]],
 PlotPoints -> 100,
 ColorFunctionScaling -> False,
 Mesh -> False,
 Boxed -> False,
 Axes -> False]

enter image description here

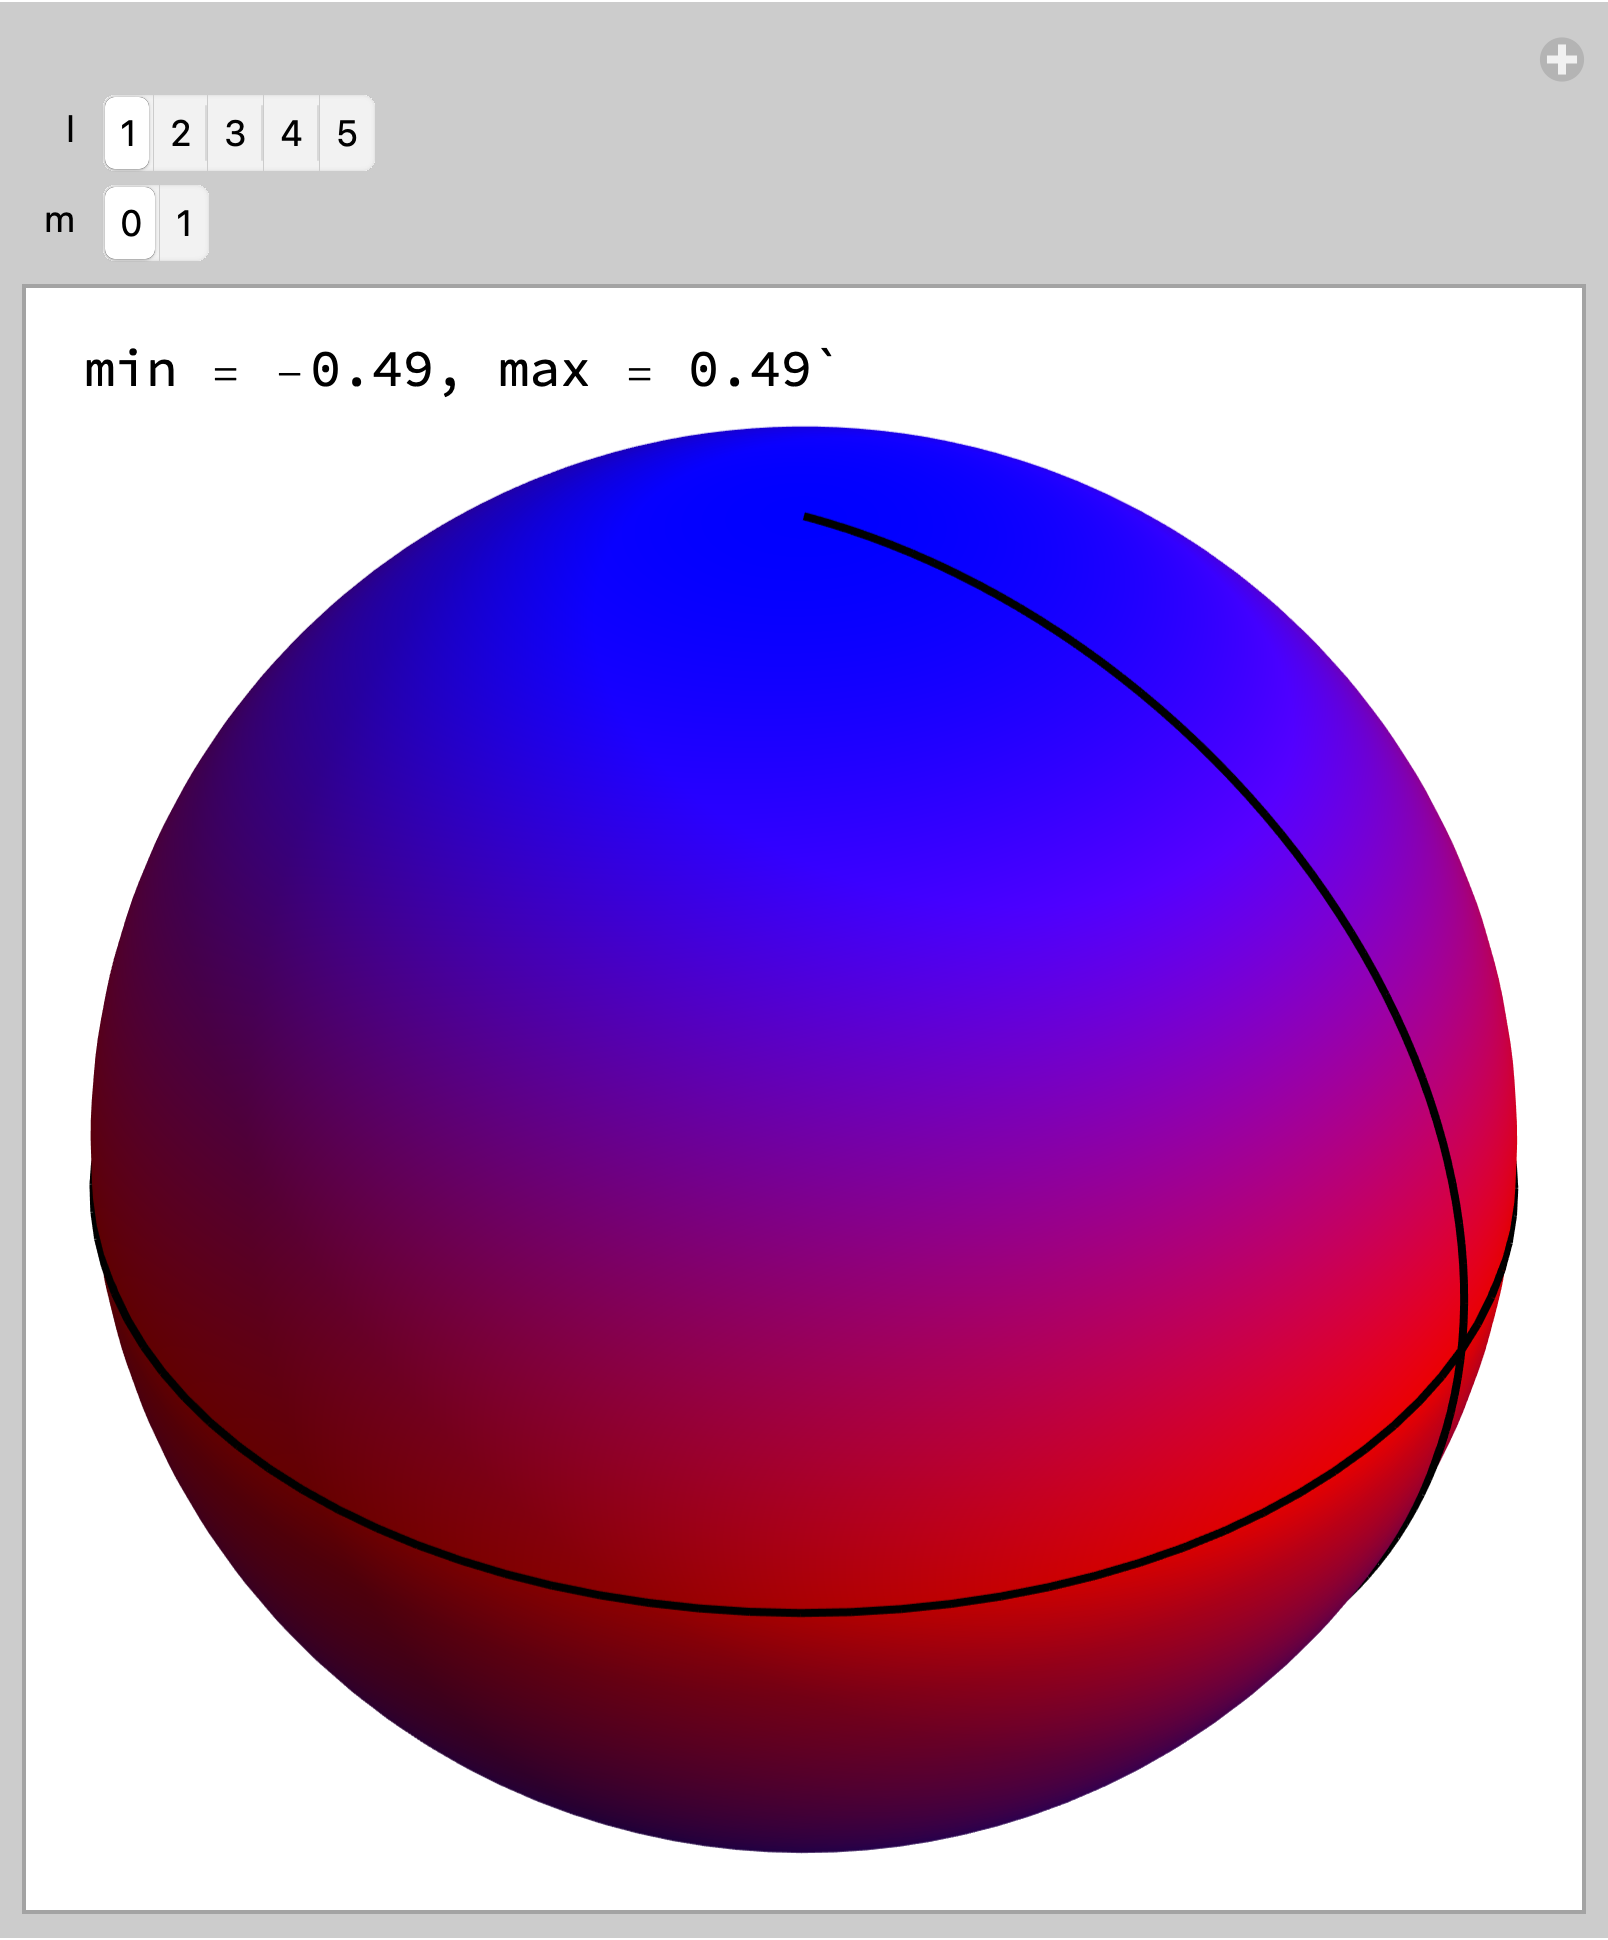
EDIT: For variable {l, m} in SphericalHarmonicY[l, m, θ, Φ]

Manipulate[
 Module[{min, max},
  m = Min[m, l];
  {min, max} = 
   N[#[{Re@SphericalHarmonicY[l, m, θ, Φ],
        0 <= θ <= Pi, 0 <= Φ <= 2 Pi}, {θ, Φ},
       WorkingPrecision -> 15] & /@
     {NMinValue, NMaxValue}];
  Column[{
    StringForm["min = ``, max = ``",
     Round[min, 0.01], Round[max, 0.01]],
    SphericalPlot3D[
     1, {θ, 0, π}, {Φ, 0, 2 π}, 
     ColorFunction -> Function[{x, y, z, θ, Φ, r},
       Blend[{Blue, Red, Blue},
        Rescale[
         Re@SphericalHarmonicY[l, m, θ, Φ], {min, 
          max}]]],
     PlotPoints -> 100,
     ColorFunctionScaling -> False,
     Mesh -> {{0.}},
     MeshFunctions -> {Function[{x, y, z, θ, Φ, 
         r},
        Re@SphericalHarmonicY[l, m, θ, Φ]]},
     MeshStyle -> {Black, Thick},
     Boxed -> False,
     Axes -> False,
     ImageSize -> Medium]}]],
 {{l, 1}, Range[5], ControlType -> SetterBar},
 {{m, 0}, Range[0, l], ControlType -> SetterBar}]
enter image description here

$\endgroup$
5
  • $\begingroup$ This is wonderful, thank you so much - I can finally understand this function. Is there a way to add black lines on the sphere when the function is zero? $\endgroup$ Commented Apr 9, 2021 at 19:23
  • $\begingroup$ Mesh -> {{0.}}, MeshFunctions -> {Function[{x, y, z, \[Theta], \[CapitalPhi], r}, SphericalHarmonicY[1, 0, \[Theta], \[CapitalPhi]]]}, MeshStyle -> {Black, Thick} $\endgroup$
    – Bob Hanlon
    Commented Apr 9, 2021 at 20:40
  • $\begingroup$ Hi Bob, many thanks. It doesn't seem to work for any arbitrary ($\ell$,$m$). Is there a way to generalize this? $\endgroup$ Commented Apr 9, 2021 at 21:57
  • $\begingroup$ @DonaldObama - I don't understand what you mean by "But the {min, max} functions are now working at all." {min, max} are not functions, they are values which are calculated using the functions {MinValue, MaxValue}. You need to have evaluated {min, max} = #[{Re@SphericalHarmonicY[1, 0, θ, Φ], 0 <= θ <= Pi, 0 <= Φ <= 2 Pi}, {θ, Φ}] & /@ {MinValue, MaxValue} to use the values. $\endgroup$
    – Bob Hanlon
    Commented Apr 9, 2021 at 22:06
  • $\begingroup$ Sorry about the confusion - that was something I did wrong - my humble apologies, sir. I edited the comment in a few mins I wrote as I figured my mistake and changed it to "is there a way to generalize this to general ($\ell$,$m$) [including the lines where the real part of the function goes to zero]"? Humble apologies on my hastiness's part, again. But I would love to know how to generalize this to any ($\ell$,$m$). $\endgroup$ Commented Apr 9, 2021 at 22:12

Your Answer

By clicking “Post Your Answer”, you agree to our terms of service and acknowledge you have read our privacy policy.

Not the answer you're looking for? Browse other questions tagged or ask your own question.