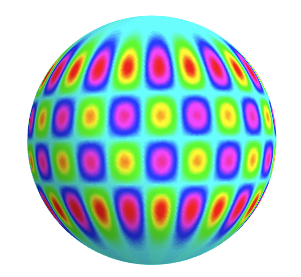
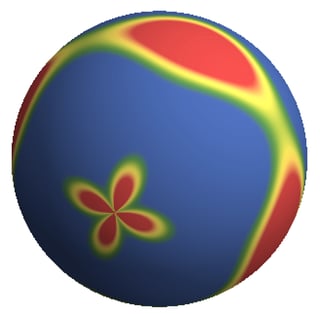
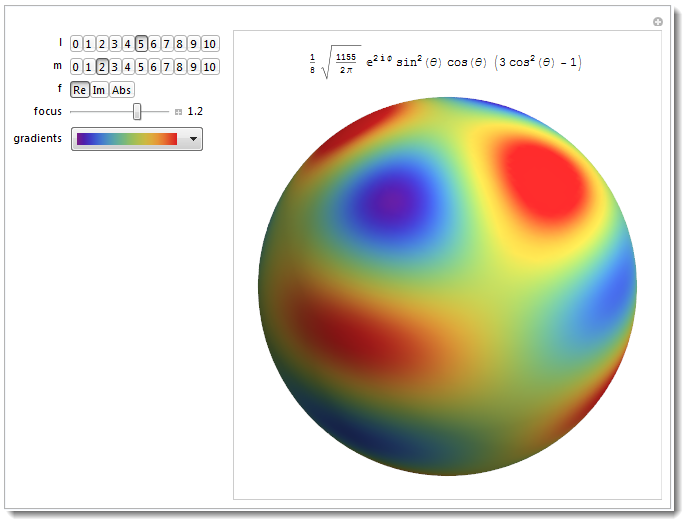
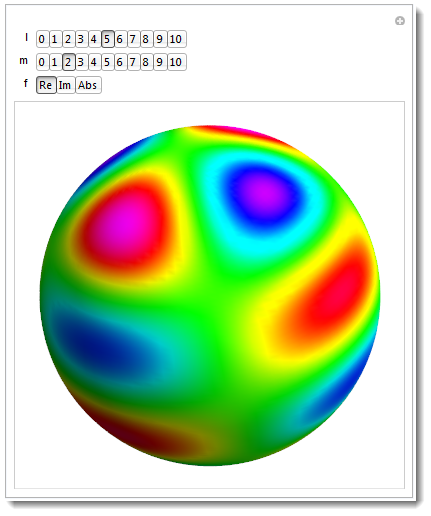
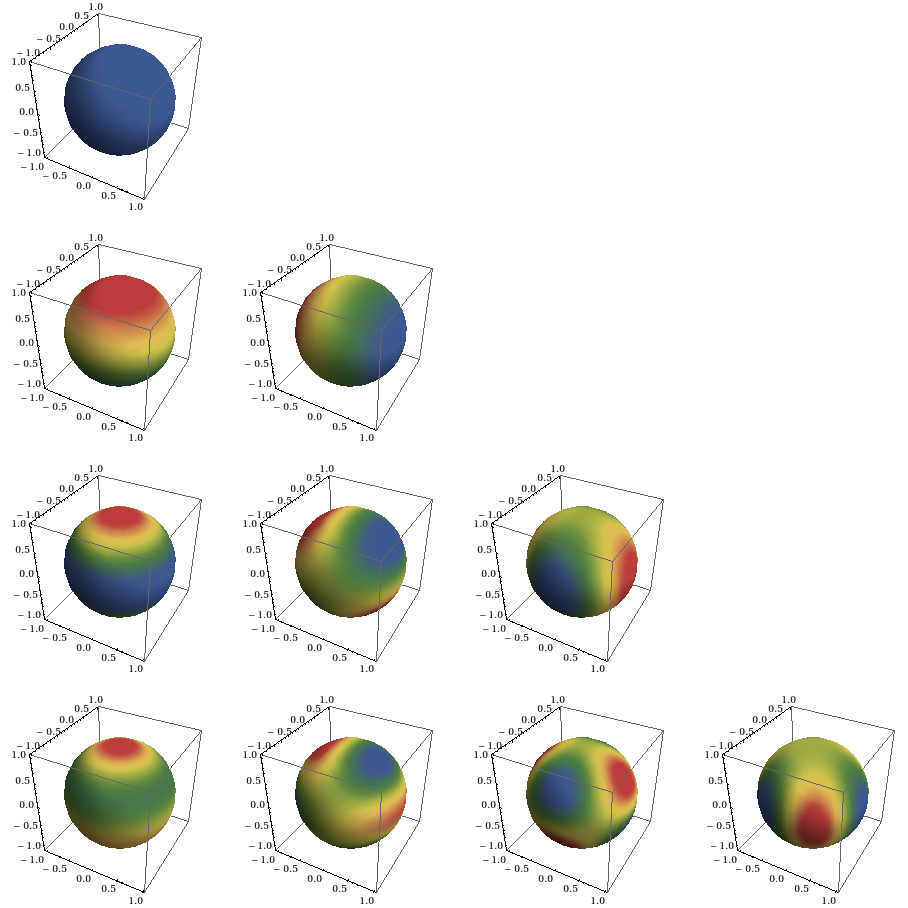
I would like to make density plots of a list of (size 2 or 3) spherical harmonics on the surface of a sphere. I'd like to plot it so that each element of that list is using a different color (red density plot for the first one, blue for the next, green... and so on)
I tried using ColorFunction like
SphericalPlot3D[1, {θ, 0, Pi}, {ϕ, 0, 2 Pi},
 ColorFunction ->
  Function[{x, y, z, θ, ϕ, r},
   RGBColor[Abs[SphericalHarmonicY[1, 1, θ, ϕ]]^2,
    Abs[SphericalHarmonicY[1, 0, θ, ϕ]]^2,
    Abs[SphericalHarmonicY[1, -1, θ, ϕ]]^2]]]
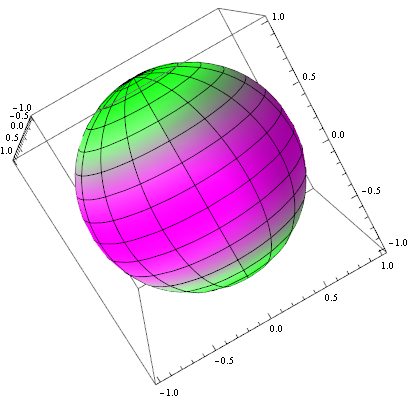
but all I get is some dark-green sphere. Is there a function like SphericalDensityPlot so that I can illustrate the functions?
Also, a big problem I'm running into is the ambient lighting direction, which interferes with what it's supposed to look like.

![Manipulate[] interface](https://i.sstatic.net/Ec8Xs.png)
