To address the Centroid issue.
 zip = EntityValue[Entity["AdministrativeDivision", {"NewYork", "UnitedStates"}],
       EntityProperty["AdministrativeDivision", "ZIPCodes"]];
list = {#, EntityValue[#, {"Polygon", "Population"}]} & /@ zip;
Eliminate Zip codes without Polygons and remove the GeoPosition head to allow us to calculate the centroids.
list2 = Complement[list,
    Cases[list, {_, {Missing["NotApplicable"], _}}]] /.
   GeoPosition -> Sequence;
list2[[All, 2, 1]] = First[#] & /@ list2[[All, 2, 1]];
centroids =
 RegionCentroid[DiscretizeGraphics[#]] & /@ list2[[All, 2, 1]]
(*{{41.2703, -71.9886}, {40.7505, -73.9974}, {40.716, -73.9865}, \
{40.7317, -73.9891}, {40.6944, -74.0158}, {40.7061, -74.0086}, \
{40.7096, -74.013}, {40.7137, -74.0083}}*)
You may get some error messages regarding issues with the graphics primitives as follows:
DiscretizeGraphics::invprim: The graphics primitive
FilledCurve[{{Line[{{40.6129,-74.0935},{40.6155,-74.0922},{40.6167,-74.0943},{40.6183,-74.0932},<<36>>,{40.61,-74.0968},{40.6124,-74.0994},{40.6157,-74.0962},{40.614,-74.0963}}]},{Line[{<<1>>}]}}]
is not valid. >>
We'll replace Indeterminate coordinates by the position of the first coordinate of the Graphics that represents the Zip Code. For that we use the following code.
y = Flatten@Position[centroids, {Indeterminate, Indeterminate}];
x = list2[[#, 2, 1]] & /@ y;
x = x[[#, 1, 1, 1, 1, 1]] & /@ Range[78];
(centroids[[y[[#]]]] = x[[#]]) & /@ Range@Length@x
Now that you have the centroids of each Zip Code you can proceed with the clustering.
data = {centroids[[#, 1]], centroids[[#, 2]],
     QuantityMagnitude[list2[[#, 2, 2]]]} & /@ Range@Length@centroids;
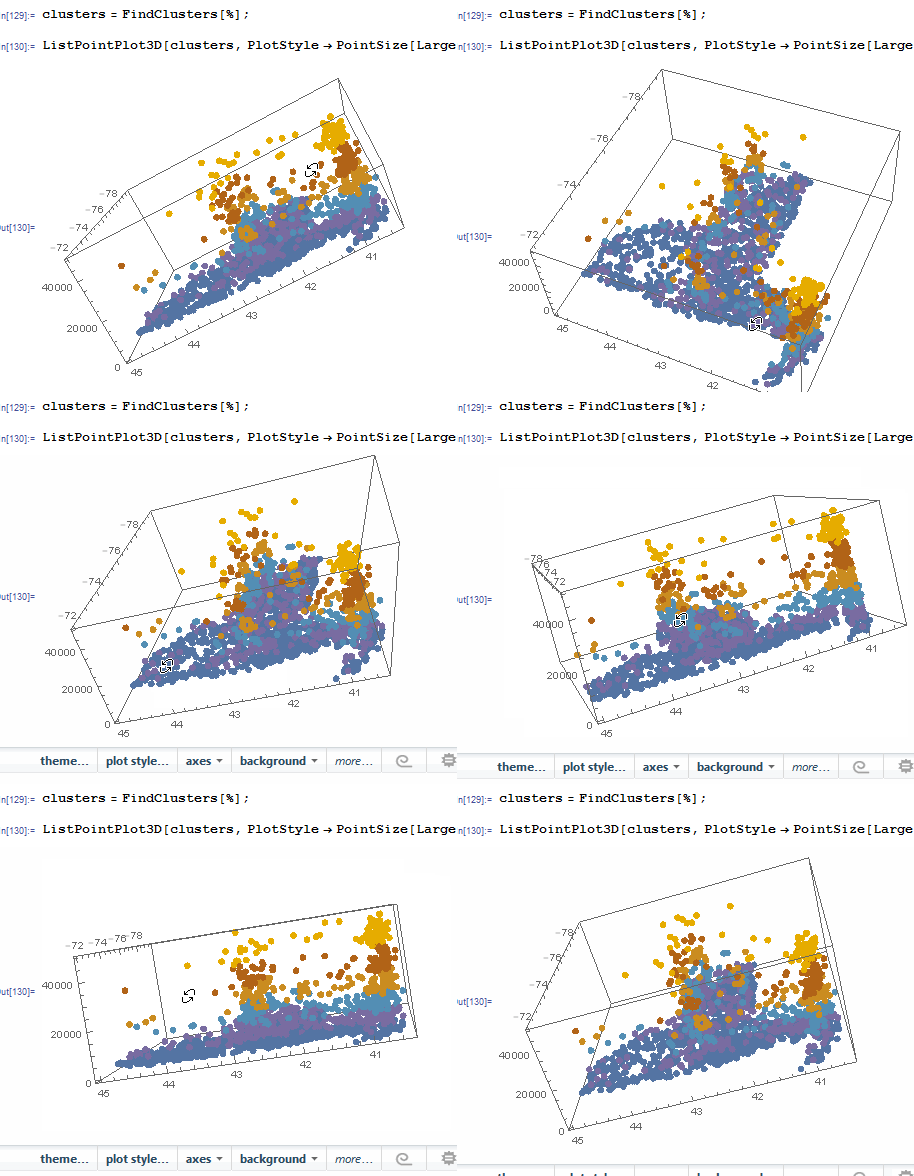
clusters = FindClusters[%];
ListPointPlot3D[clusters, PlotStyle -> PointSize[Large]]

Please read the documentation on FindClusters, you may want to build your own custom DistanceFunction to give the weight you want to the distance between centroids vs the population in the Zip Code. You can also establish the number of clusters you want. In this example I left the DistanceFunction as the default, which gives the weight to the population (as you can see on the chart above, the clusters are layered along the Z axis).
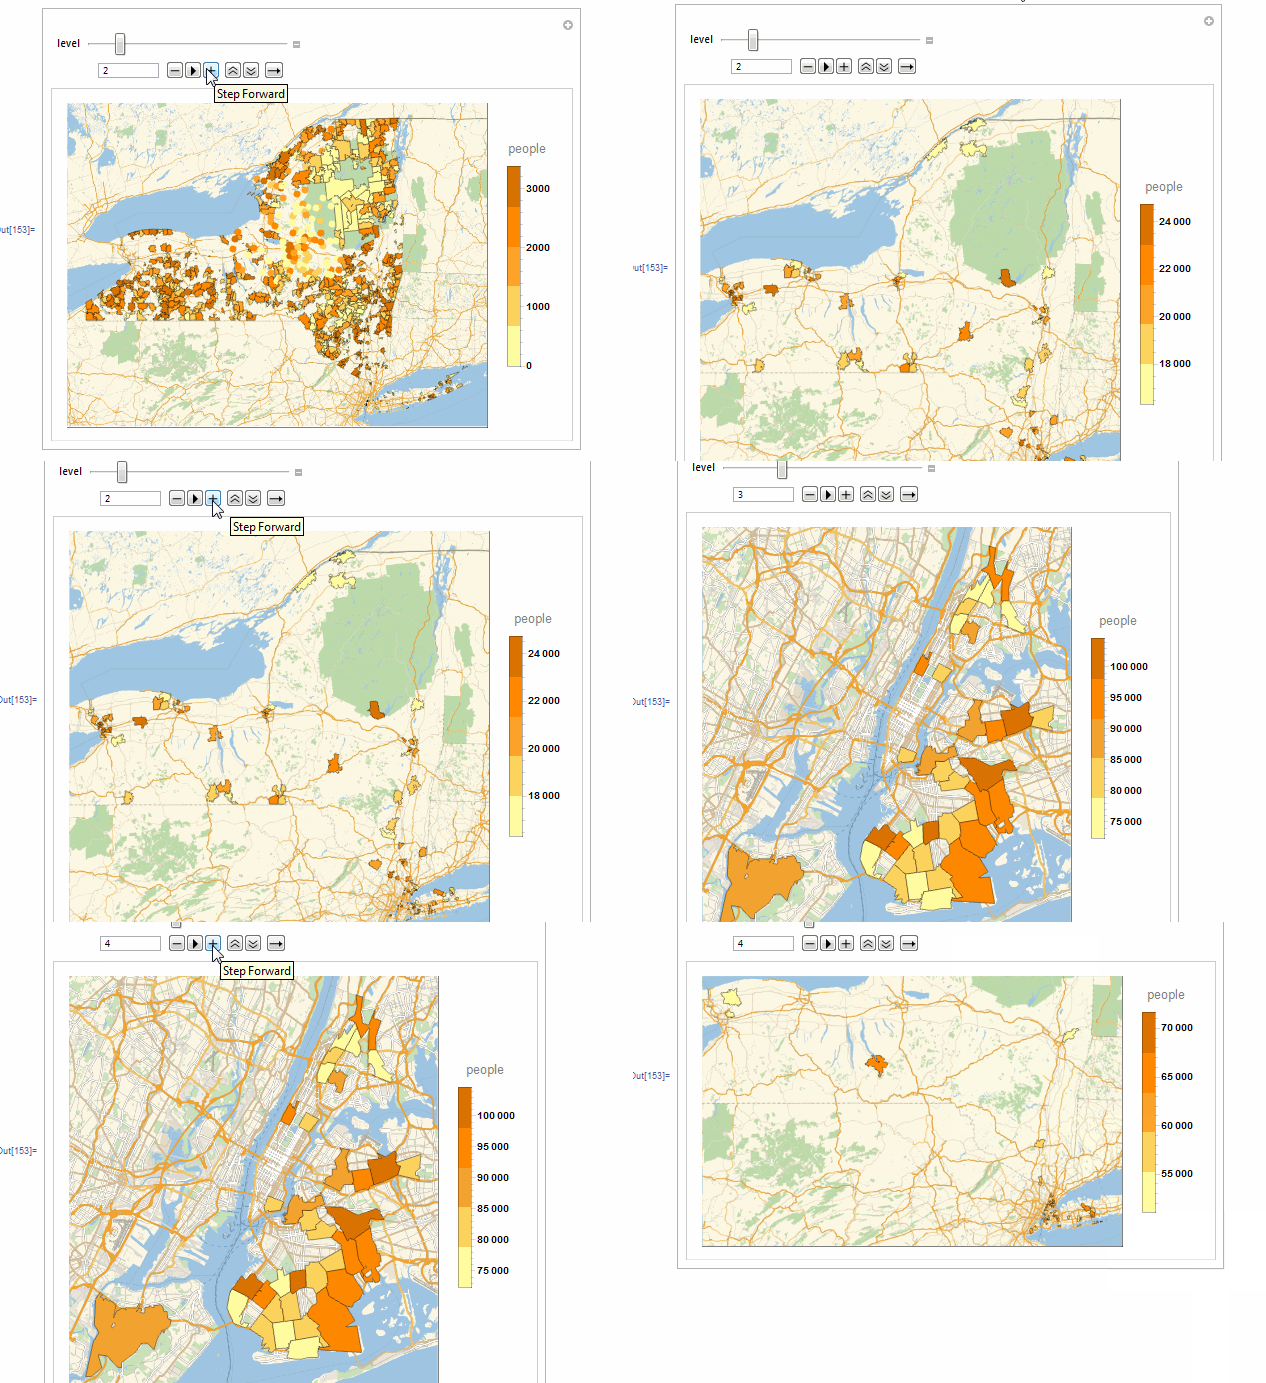
Now we can project the clusters into the map
Manipulate[
 GeoRegionValuePlot[{list2[[#, 1]], list2[[#, 2, 2]]} & /@
   Flatten[Position[centroids, #] & /@ clusters[[level, All, ;; 2]]],
  GeoBackground -> "StreetMapNoLabels"], {{level, 1}, 1,
  Length@clusters, 1}, SynchronousInitialization -> False,
 SynchronousUpdating -> False]

Regarding the bounty questions:
1) is there a way to limit cluster size by population (i.e. each cluster can only contain at most N people)?
Yes, you can build your own cluster analysis and can incorporate whatever conditions you may want to use. Please check out the wikipedia article on Cluster Analysis to guide you in the possible algorithms that you may want to use as the base.
2) is there a way to force the clusters to be contigious?
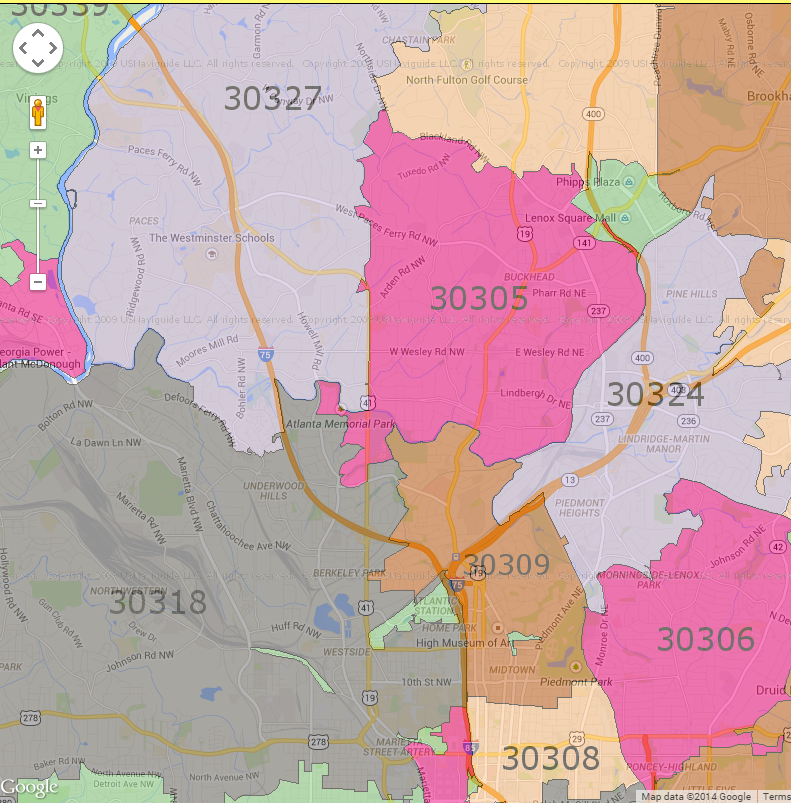
Yes, Please check the code below. I'm using Atlanta due to network performance issues. A custom function coords[zipA,zipB] will return 1 if the zip codes are contiguous, otherwise 0.
zips=GeoEntities[Entity["City",{"Atlanta","Georgia","UnitedStates"}],"ZIPCode"];
polygons = EntityValue[#, "Polygon"] & /@ zips;
zips = Delete[zips, Position[polygons, _Missing]];
polygons = Delete[polygons, Position[polygons, _Missing]];
coordinates =
  Flatten[#,
     1] & /@ (Cases[#, {a_, b_} -> {a, b}, Infinity] & /@
       Cases[#, GeoPosition[a_] -> a, Infinity] & /@ polygons);
db = {zips[[#, 2]], coordinates[[#]]} & /@ Range@Length@coordinates;
coords[zip_] := Cases[db, {zip, {b__}} -> b]
contiguous[listA_, listB_] :=
 If[Length[Intersection[listA, listB]] > 0, 1, 0]
Test

{contiguous[coords["30309"], coords["30327"]],
 contiguous[coords["30309"], coords["30308"]]}
(*{0,1}*)


