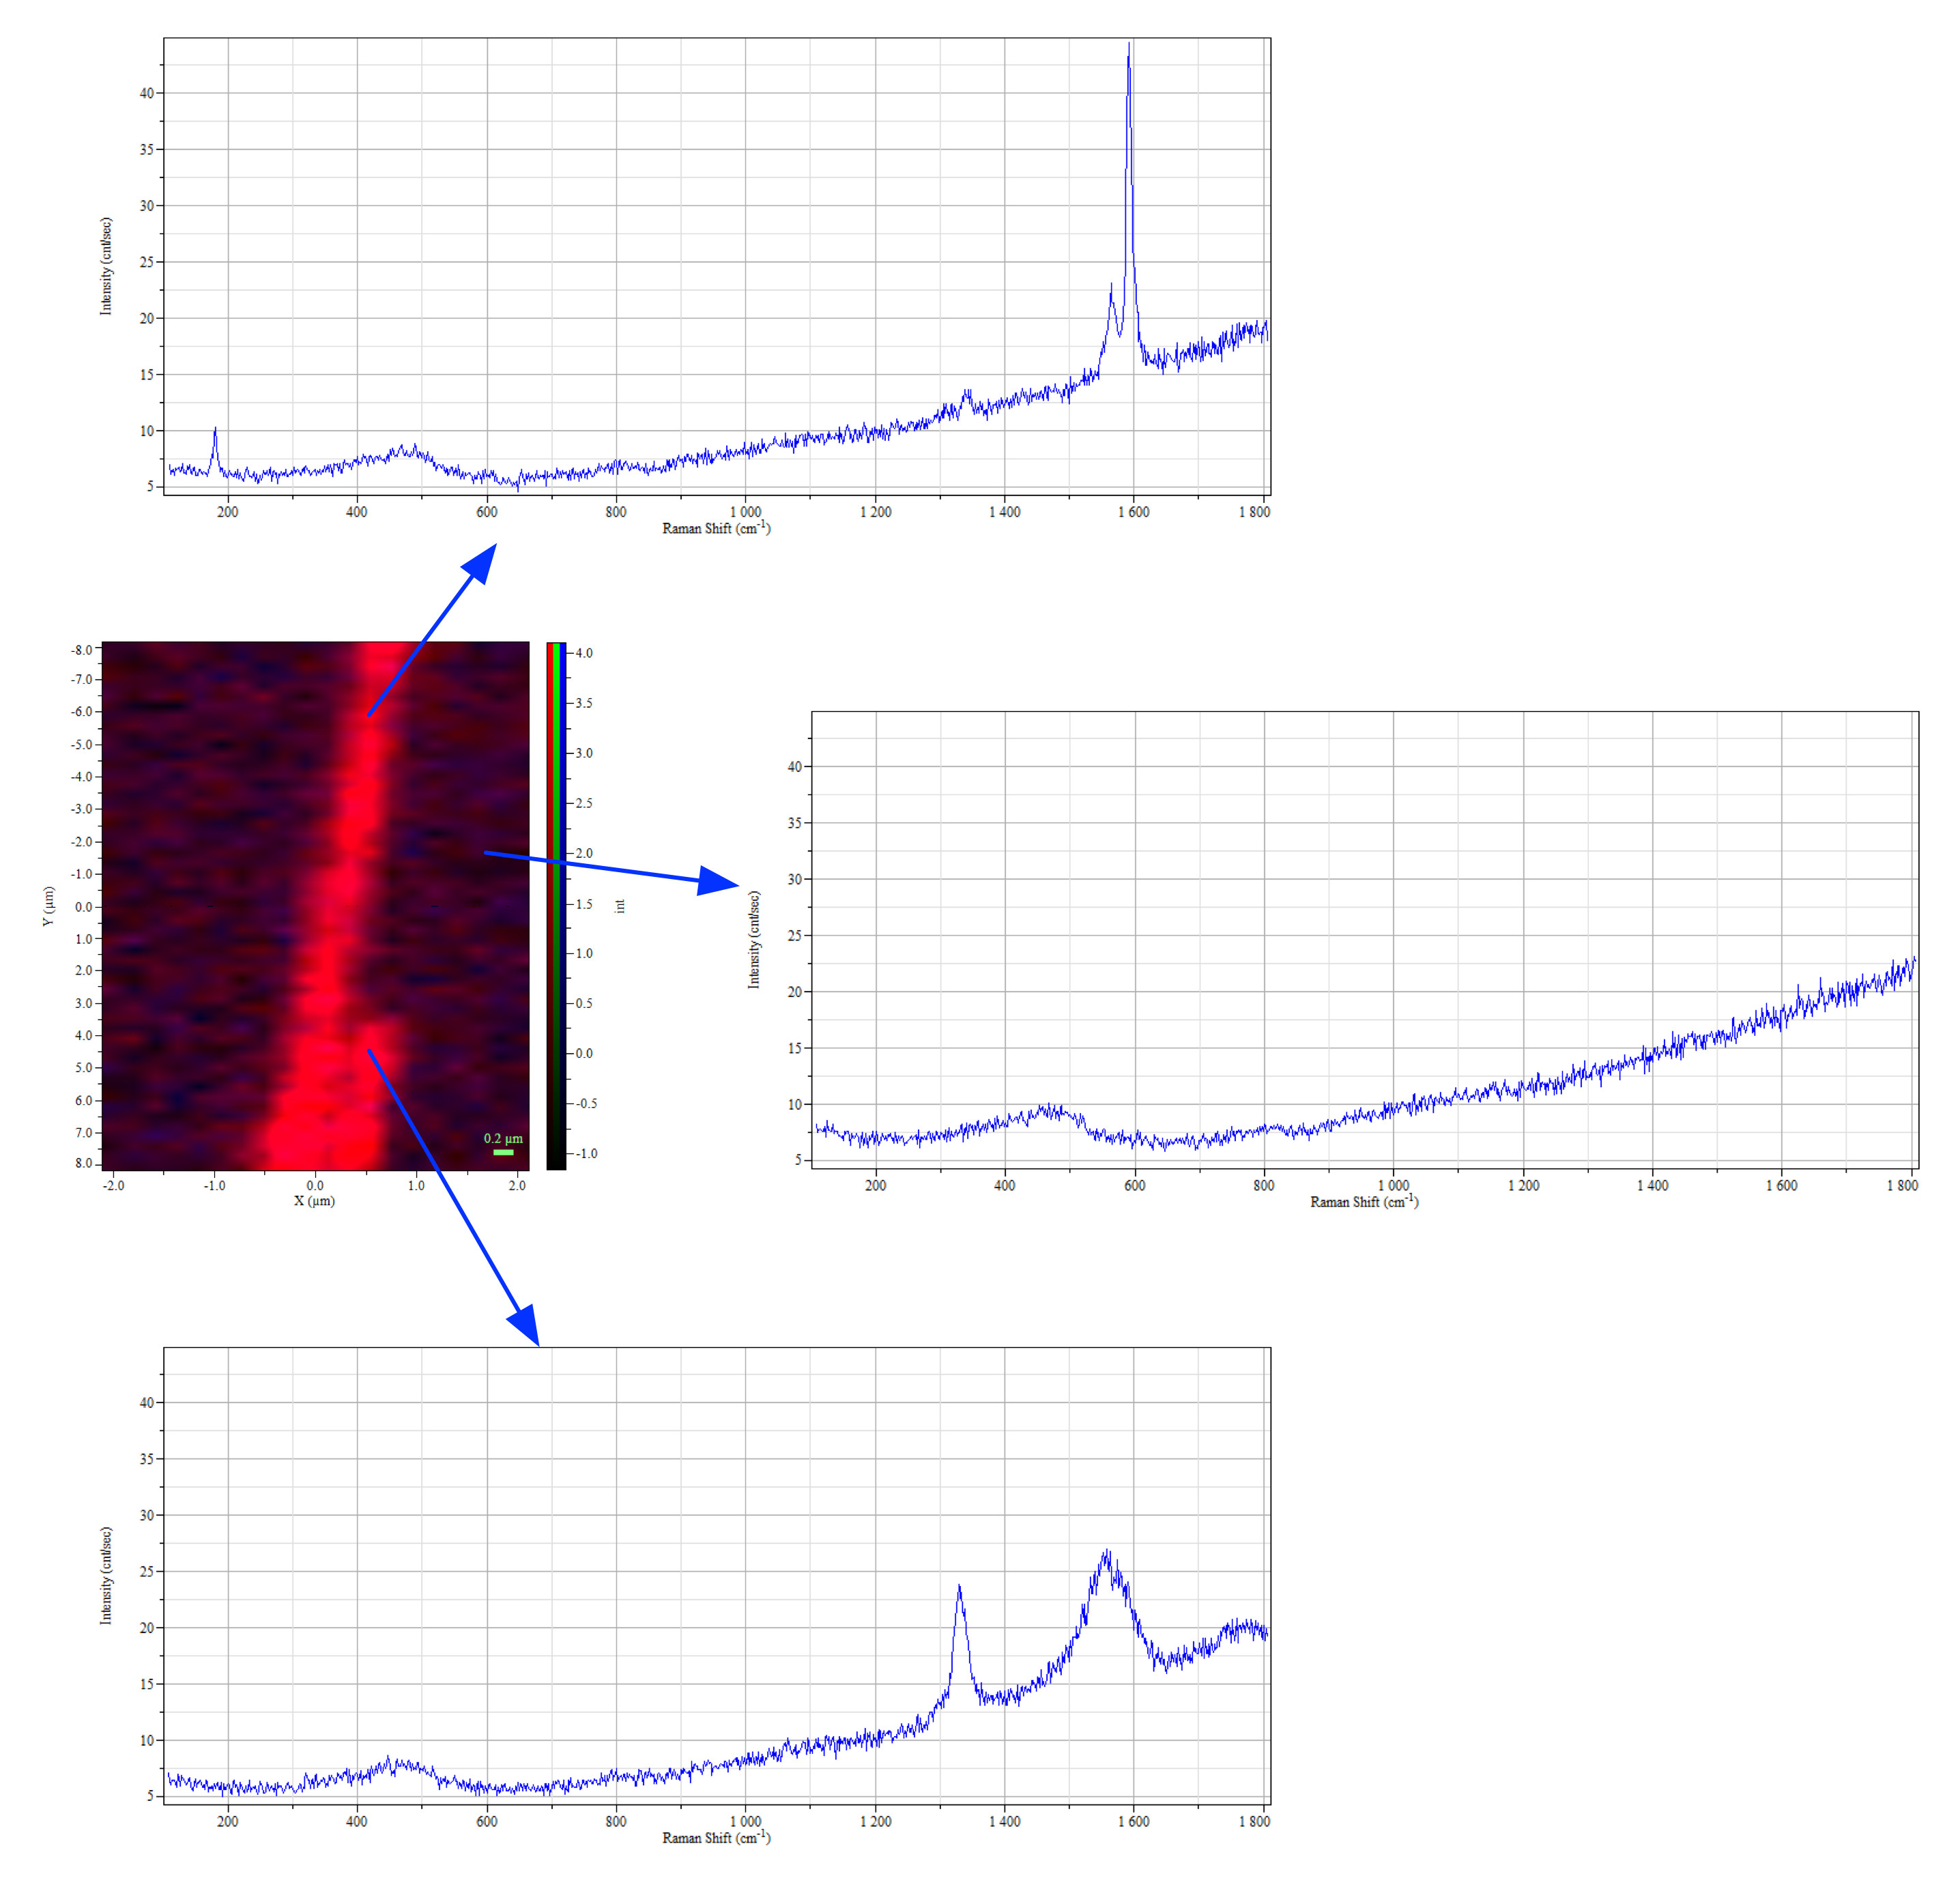
I have experimental 2D-spectroscopy data, in a format similar to this:
|    |    | f1 | f2 | f3 | . . .
| x1 | y1 | I  | I  | I  | . . .
| x1 | y2 | I  | I  | I  | . . .
| .  | .  | .  | .  | .  | . . .
| .  | .  | .  | .  | .  | . . .
where {x1,y1} are the map coordinates, f1-fn represent the frequency axis values and the rest is the Intensity (counts/second) obtained for each frequency.
What I'd like to be able to do is to let Mathematica model the clusters of similar spectra inside this map, to find its main components. So I've been looking into clustering methods, but so far it's been a bit over my head. Ideally I'd like a solution where
- I can define the number of clusters to look for (e.g. if I know of mainly two type of spectra to be present in the map, it should look for 2 clusters + background)
- allow me to define some kind of threshold value that defines how close the individual spectra are allowed to be to each other
- obtain the errors from this cluster-fit
- If possible predefine the components representative spectra, if I already have a good model function for them.
- Let me then export the spectra based on similarity (e.g. points more than 90% likely to stem from one component) so that I can fit them afterwards and create histograms
- let me visualise the resulting clusters on the xy-grid
So, to cut a long story short: how do I get arrays of xy-Points containing similar spectra?
Edit: added an image depicting the situation


