I am trying to graphically display a distance matrix with similar elements visually clustered into groups.
My original matrix has the elements in a random order so the first thing I do is to change the ordering of those elements using DirectAgglomerate
Needs["HierarchicalClustering`"]

ClusteringPermutation[distanceMatrix_, linkage_] :=
  Module[{indices, cluster},
    indices = Range[Length @ distanceMatrix];
    cluster = DirectAgglomerate[distanceMatrix, indices, Linkage -> linkage];
    Reverse @ ClusterFlatten[cluster]
  ]
My overall function to permute the matrix then looks like this:
PermuteMatrix[distanceMatrix_, linkage_] :=
  Module[{newOrder},
    newOrder = ClusteringPermutation[distanceMatrix, linkage];
    distanceMatrix[[newOrder, newOrder]]
]
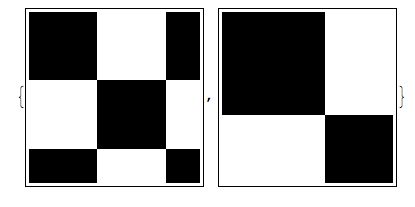
Given an example matrix:
sampleMatrix =
  {{1, 1, 0, 0, 1}, {1, 1, 0, 0, 1}, {0, 0, 1, 1, 0}, {0, 0, 1, 1, 0}, {1, 1, 0, 0, 1}};
PermuteMatrix[sampleMatrix, "Single"]
{{1, 1, 0, 0, 0}, {1, 1, 0, 0, 0}, {0, 0, 1, 1, 1}, {0, 0, 1, 1, 1}, {0 ,0, 1, 1, 1}}
The matrix is now rearranged with the similar clusters being together.
I then plot the result as a heat map while applying the same permutation to the element labels.
Everything works fine until I get to matrices over 250 x 250 in size. In this case, the Mathematica kernel crashes for some reason when evaluating DirectAgglomerate. Is this the limitation of the function or am I doing something clearly wrong?
Any help would be greatly appreciated. I am definitely no expert on clustering; perhaps there is a completely different way to go about this?
UPDATE (09.10.13)
Tried to use MinimumBandwidthOrdering as suggested by bill s but quickly ran into issues with larger matrices where groups of similar samples were broken up. Here's an example:
mSubset={{0, 0, 0.272352, 0, 0.272364, 0.272261, 0, 0.272269}, {0, 0,
0.272501, 0, 0.272514, 0.272411, 0, 0.272419}, {0.272352, 0.272501,
0, 0.272038, 0, 0, 0.272158, 0}, {0, 0, 0.272038, 0, 0.272049,
0.271947, 0, 0.271955}, {0.272364, 0.272514, 0, 0.272049, 0, 0,
0.272169, 0}, {0.272261, 0.272411, 0, 0.271947, 0, 0, 0.272068,
0}, {0, 0, 0.272158, 0, 0.272169, 0.272068, 0, 0.272075}, {0.272269,
0.272419, 0, 0.271954, 0, 0, 0.272075, 0}}

permutedMatrixOrig = PermuteMatrix[msubset, "Single"]
{r, c} = MinimumBandwidthOrdering[msubset, Method -> "Sloan"];
{r2, c2} = MinimumBandwidthOrdering[msubset, Method -> "RCMD",
RefinementMethod -> None];
{ArrayPlot[msubset],
ArrayPlot[permutedMatrixOrig],
ArrayPlot[msubset[[r, c]]],
ArrayPlot[msubset[[r2, c2]]]}
I have tried playing around with the method and refinement options but was still unable to fully group all my samples. I have also noticed that for very large matrices my indices for rows and columns were different - could this have something to do with my matrices not being fully symmetrical?


ClusterFlattendefined? $\endgroup$ClusterFlattenandDirectAgglomeratecome from theHierarchicalClusteringpackage. I have added the omittedNeeds. $\endgroup$