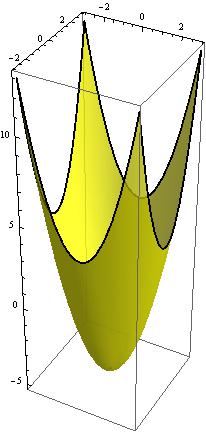
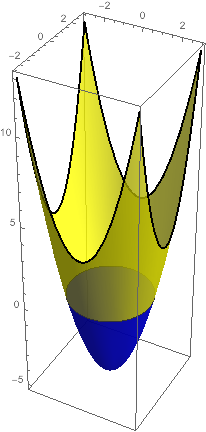
I am trying to create a plot of a surface that is yellow above the xy-plane (z>0), but blue below (z<0). My first attempt was to use ColorFunction->Function[{x,y,z},If[z>0,Hue[0.2],Hue[0.6]], but this only gave me a solid yellow paraboloid. I also tried defining a custom ColorFunction scheme with cf=Piecewise[{{Yellow,0<#3<30},{Blue,-70<#3<0}}]&; and ColorFunction->cf to the same result. Finally, I tried the following based on another thread (Discrete coloring in Plots):
ParametricPlot3D[{x,y,x^2+y^2-5},{y,-3,3},{x,-3,3},PlotStyle->Opacity[.8],ColorFunction->(If[#3>0,Yellow,Blue]&),Mesh->False,BoundaryStyle->{Black,Thickness[.01]}]
Every time, I end up with this:

Any help you can offer would be greatly appreciated.


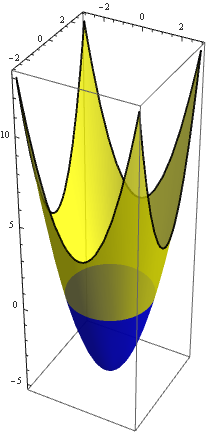
ColorFunctionScaling -> False? and a large value forPlotPoints, e.g.,PlotPoints -> 150. $\endgroup$PlotPoints->100works, but it slows everything down. i.imgur.com/tFh63XY.jpg $\endgroup$MeshFunctions -> {#3 &}, Mesh -> {{0}}, MeshStyle -> Directive[Blue, Opacity[.8], Thickness[.01]]. ... Just learned myself the best way: Michael's approach usingMeshShading:) $\endgroup$