18
$\begingroup$

I am trying to visualize a problem I am working on. For this, I need $n$ distinct colors which are preferably easy to distinguish. (Obviously, the higher the $n$ is, the harder it is to distinguish the colors.)

I was using the ColorData["index","ColorList"]. However, through a crash of my procedure, I found out that the number of colors in the schemes is limited. The documentation on different ColorLists is not very extensive, so with simple loop I found out that the maximum number of colors in a scheme ranges from $4$ to $21$. It is however not straightforward to see how many colors are in each scheme. Note, for $n = 5$ it is not optimal to use selection of $21$ colors.

For given $n$, is there a simple way to get color sheme with $n$ easy to distinguish colors?

$\endgroup$
4

4 Answers 4

13
$\begingroup$

Function to generate n equally-spaced colors:

discreteColors[n_] := 
 With[{partL = Ceiling[Sqrt[n]]}, 
  DeleteCases[
   Flatten[Transpose[
     Partition[
      Table[Lighter[Darker[Hue[c], .1], .25], {c, 0, 1 - 1/n, 1/n}], 
      partL, partL, 1, 0]]], 0]]

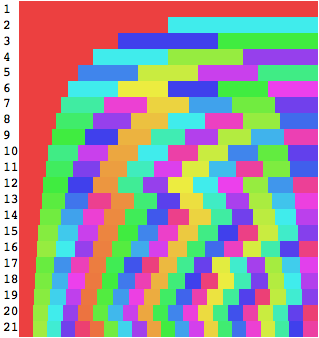
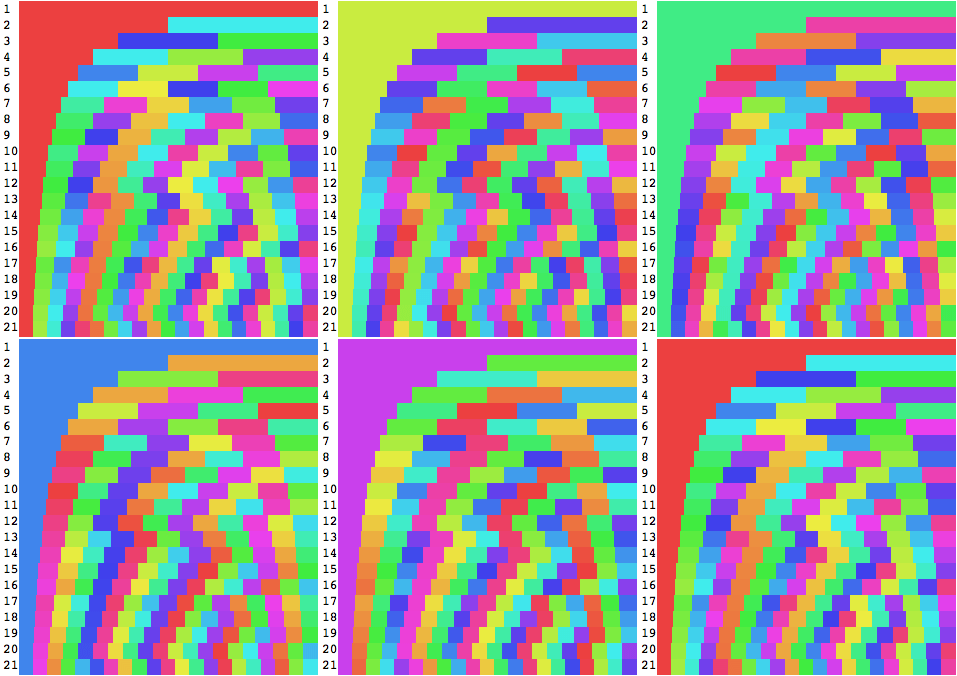
Generated color tables for n = 1 ... 21:

nmax = 21;
Row[{Column[Range[nmax], Spacings -> .3],
  Column[Table[
    Graphics[
     Table[{discreteColors[n][[i]], 
       Rectangle[{i, 0}, {i + 1, 1}]}, {i, n}], PlotRangePadding -> 0,
      AspectRatio -> 1/20, ImageSize -> 300],
    {n, nmax}], Spacings -> 0]
  }]

color tables

EDIT

You can also change the initial color:

discreteColors[n_, s_] := 
 With[{partL = Ceiling[Sqrt[n]]}, 
  DeleteCases[
   Flatten[Transpose[
    Partition[
     Table[Lighter[Darker[Hue[c], .1], .25], {c, 0 + s, 1 - 1/n + s, 
       1/n}], partL, partL, 1, 0]]], 0]]

color shift animation

$\endgroup$
17
$\begingroup$

Though not answering your question, but perhaps useful an other time. I have extracted the colors from (financial) charts published by Apple, using a colormeter. In my view these charts are always well designed.

Apple charts have standard 6 colors:

(* Apple colors *)
blue = RGBColor[17.6/100, 41.6/100, 63.1/100];
green = RGBColor[34.9/100, 66.7/100, 33.3/100];
yellow = RGBColor[96.9/100, 68.6/100, 20.8/100];
red = RGBColor[86.3/100, 13.3/100, 19.6/100];
purple = RGBColor[55.3/100, 27.5/100, 55.7/100];
grey = RGBColor[55.7/100, 57.3/100, 56.9/100];
(* 6 Apple colors *)
apple6 = {blue, green, yellow, red, purple, grey}; 

enter image description here

In my view Mathematica's Orange blends in well:

apple7 = {blue, green, yellow, Orange, red, purple, grey}; 

enter image description here

A rare 13 color tabel from Apple is:

c01 = RGBColor[58.4/100, 38.8/100, 23.9/100];
c02 = RGBColor[62.4/100, 63.5/100, 63.1/100];
c03 = RGBColor[58.0/100, 41.6/100, 61.2/100];
c04 = RGBColor[84.3/100, 36.1/100, 33.7/100];
c05 = RGBColor[96.1/100, 71.8/100, 40.8/100];
c06 = RGBColor[50.2/100, 67.8/100, 43.5/100];
c07 = RGBColor[29.0/100, 50.2/100, 67.1/100];
c08 = RGBColor[56.1/100, 57.3/100, 56.9/100];
c09 = RGBColor[51.4/100, 34.5/100, 54.5/100];
c10 = RGBColor[81.2/100, 27.5/100, 23.5/100];
c11 = RGBColor[94.9/100, 67.8/100, 31.0/100];
c12 = RGBColor[42.7/100, 62.7/100, 36.1/100];
c13 = RGBColor[18.8/100, 43.5/100, 61.6/100];
apple13 = {c01, c02, c03, c04, c05, c06, c07, c08, c09, c10, c11, c12, c13};

enter image description here

$\endgroup$
9
$\begingroup$

However, through a crash of my procedure, I found out that the number of colors in the schemes is limited.

This is not correct. The first indexed color scheme has many colors:

ColorData[1, "Range"]

(* {1, ∞, 1} *)

If you want to create your own, you could look at its InputForm

ColorData[1] // InputForm

(* ColorDataFunction[1, "Indexed", {1, Infinity, 1}, 
 (ToColor[Hue[N[FractionalPart[0.67 + (2*(#1 - 1))/GoldenRatio]], 
      0.6, 0.6], RGBColor] & )[Floor[#1 - 1, 1] + 1] & ] *)

and you see how they try to create many different values. You could simply adapt this and use it with one of the gradient schemes

With[{func = 
   ColorData["BrightBands"][
       N[FractionalPart[0.67 + (2*(#1 - 1))/GoldenRatio]]] & [
     Floor[#1 - 1, 1] + 1] &},
 Graphics@Table[{func[i], Rectangle[{i, 0}, {i + 1, 5}]}, {i, 1, 30}]
 ] 

Mathematica graphics

$\endgroup$
1
$\begingroup$

Just as an idea (had no time to program it yet). Take colors a little bit better distributed than Hue[] (remap e.g.) and distribute them "in" a sphere. Meaning the equator has the color circle, poles are black and white. To the inside it gets gray. So the line connecting the poles goes from black to white in graylevels. Now take the n points and distribute them "equally" in the sphere. That is slightly more complicated than distributing points on a sphere. That is not really "easy", but starting from the question, I will give it a try, once I have time. Trick will be to make it fast (and reproducible).

$\endgroup$

Your Answer

By clicking “Post Your Answer”, you agree to our terms of service and acknowledge you have read our privacy policy.

Not the answer you're looking for? Browse other questions tagged or ask your own question.