First answer
Ok, Simon Woods killed the fun but I was already wiriting this:
spec = List @@@ Table[ ColorData["SunsetColors", i]
                       , {i, 0, 1, .001}] // Transpose;

ListLinePlot[spec, ImageSize -> 900, PlotStyle -> {Red, Green, Blue},
                    BaseStyle -> Thick]

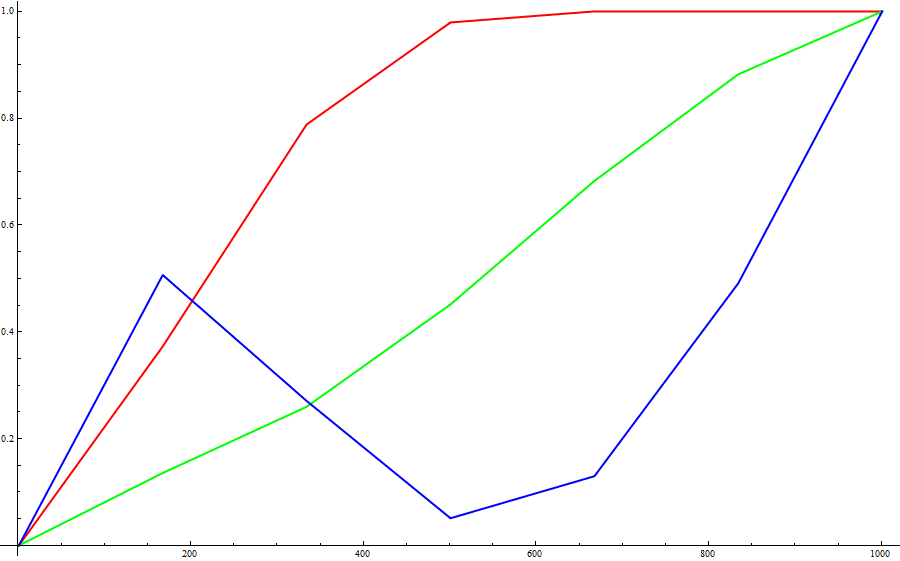
Here we can see how colors are changing across 0-1. It is clearly seen that thare are only a couple of base colors, which are annouced by derrivative change. Let's find those colors.
First, the positions:
change = Accumulate @ (Length /@
        (Round[#, 0.000001] & /@ (Subtract @@@ Partition[spec[[3]], 2, 1]) // Split))
(*not very elegant way to find breaks but I'm in hurry*)
{166, 167, 333, 334, 500, 666, 667, 833, 834, 1000}
No need to do this automaticaly so at the end I left:
change = {0, 166, 333, 500, 666, 833, 1000}
And those are our colours:
colors = Blend["SunsetColors", #] & /@ (change/1000)
{RGBColor[0., 0., 0.], RGBColor[0.371302, 0.135257, 0.504477],
   RGBColor[0.787456, 0.259568, 0.271249],
   RGBColor[0.979377, 0.451467, 0.0511329],
   RGBColor[0.999918, 0.681763, 0.129456],
   RGBColor[1., 0.881837, 0.490371], RGBColor[1., 1., 1.]}
GraphicsGrid[{
          {Graphics[Table[{Blend[colors, x], Disk[{8 x, 0}]}, {x, 0, 1, 1/50}]]},
          {Graphics[Table[{Blend["SunsetColors", x], Disk[{8 x, 0}]}, {x, 0, 1, 1/50}]]
             }}, ImageSize -> 900]

Update
Like I've said in comments I think all available color schemes are created via Blend so we do not have to worry about "positions" of each one in color list but the only question is, how many colors are used for each scheme? Then we can take base as sample of equally spaced colors. To prove I'm right:
col = ColorData["Gradients"];

test = {};
Do[
   palette = col[[i]];
   (*following procedure is counting how many lines create given spectrum,
     like in the picture*)
   n = Fold[#2@# &,
            palette,
            {(List @@@ Table[Blend[#, i], {i, 0, 1, .001}])[[;; , 2]] &,
             Round[Differences@#, 10^-6] &,
             Split,
             Length /@ # &,
             Select[#, # > 10 &] &,
             Length
             }];
   basecolors = Blend[palette, #] & /@ Range[0, 1, 1/n]; (*our predictions*)
   realbase = DataPaclets`ColorDataDump`getColorSchemeData[palette][[5]];
   (*real base colors*)
   AppendTo[test, realbase == basecolors]; (*test*)
   , {i, Length@col}];

 test
{True, True, True, True, True, True, True, True, True, False, True, \
True, True, True, True, False, True, True, True, True, True, True, \
True, True, True, True, True, True, True, True, True, False, True, \
True, True, True, True, True, True, True, True, True, True, True, \
True, True, True, True, True, True, True}
There are couple of Falses, it is because sometimes slopes are so similar that above naive procedure is not able to distinguish them and we end up with underestimated number of lines.
Also if we choose other color to look for lines (*here it is Green, it is set there: [[;; , 2]] *) procedure will fail somewhere else, that's reasonable, it is all because of poor implementation :)
But the point is, my anticipation was correct.


