So I thought that I knew what was going on. I defined my own color function like this:
myRainbow = Function[x, Blend[{Purple, Blue, Green, Yellow, Red}, x]];
Everything looks fine and dandy. So let's test it out!
nd[y_, a_, b_, n_] :=
  (Binomial[b - a + 1, y] *
     Sum[((-1)^i)*Binomial[y, i]*((y - i)/(b - a + 1))^n, {i, 0, y}]);
ArrayPlot[Table[nd[3, 1, K, n], {K, 1, 15}, {n, 1, 15}],
  ColorFunction -> myRainbow, DataReversed -> True]
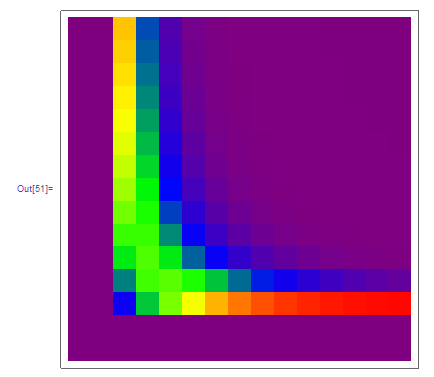
Output:
Wow, it looks fantastic! It's doing exactly what I thought it would. Great, right? Well, let's try it on a DiscretePlot3D version of the same function:
DiscretePlot3D[nd[3, 1, k, n], {n, 1, 15}, {k, 1, 15},
  PlotRange -> {0, 1}, ExtentSize -> Full, ColorFunction -> myRainbow]
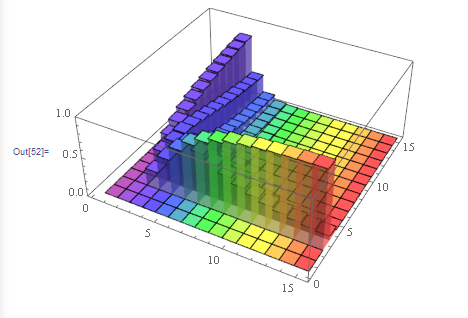
Output:
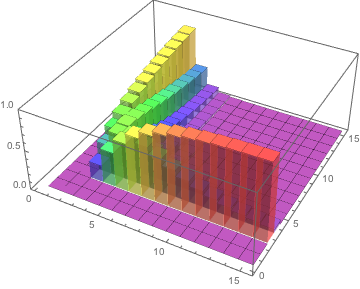
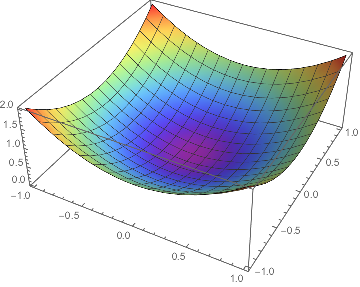
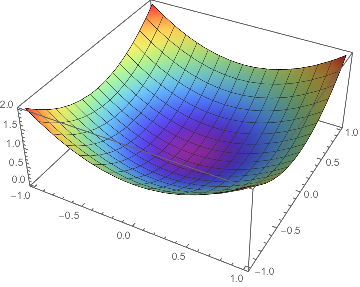
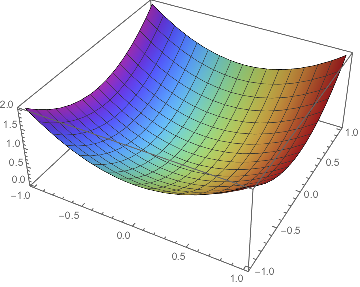
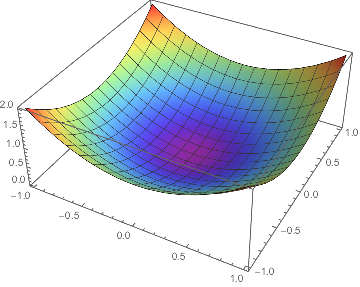
Whoa. Something's not right here. Suddenly Mathematica is deciding to use of the value of n in the color function instead of the output of my function nd. Clearly something hasn't been done right here, but I cannot figure out what. I'm assuming that I didn't define my color function correctly, because if, for example, I use the built-in color functions like "DarkRainbow," both plots behave as expected. So what needs to be changed in my color function definition to get the desired output? Also, if I turn off color function scaling, how do I control which values get mapped to each color?
The main problem here seems to be that I just don't know how to properly define my own custom color functions.

