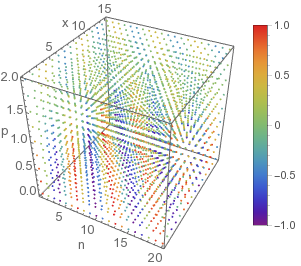
Suppose I have a relationship between four different variables, two of which are discrete and the other two are continuous. For example, let's look at the Binomial Distribution's PMF. If a random variable $X$ follows $B(n,p)$, meaning $P(X=x)= {n \choose x}p^x(1-p)^{n-x}$, then the four values I would want to plot would be:
$P(X=x)$, which is continuous and between 0 and 1.
$x$, which is discrete and a non-negative integer.
$n$, which is discrete and a non-negative integer.
$p$, which is continuous and between 0 and 1.
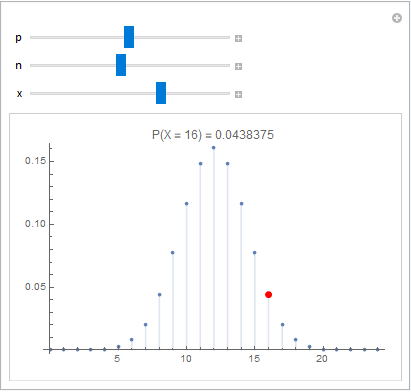
The only way that I can think of to effectively visualize this in Mathematica would be to use an ArrayPlot with the $x$ and $n$ being the axes and one of $P(X=x)$ or $p$ being mapped to a color function and the other to "time" (such as a slider in manipulate or an animation).
But suppose I wanted one axis of ArrayPlot to be one of the continuous variables and another to be one of the discrete variables. Well, ArrayPlot isn't really the best for the job anymore. But I'm not sure what other options would be good for the job. How would you do it?


ContourPlot3Dmight be a candidate. $\endgroup$