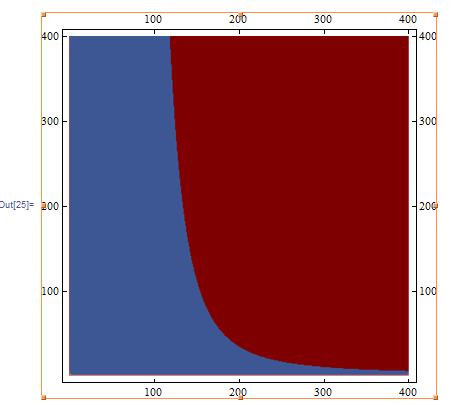
Observe the following function I have defined in Wolfram Mathematica and the array plot below:
nd[y_, a_, b_,
   n_] := (Binomial[b - a + 1, y]*
    Sum[((-1)^i)*Binomial[y, i]*((y - i)/(b - a + 1))^n, {i, 0, y}]);
ArrayPlot[Table[nd[1, 1, K, n], {K, 1, 400}, {n, 1, 400}],
 ColorFunction -> "BlueGreenYellow", DataReversed -> True, ColorFunctionScaling->False,
 FrameStyle -> Directive[Thin, Black], FrameTicks -> Automatic]
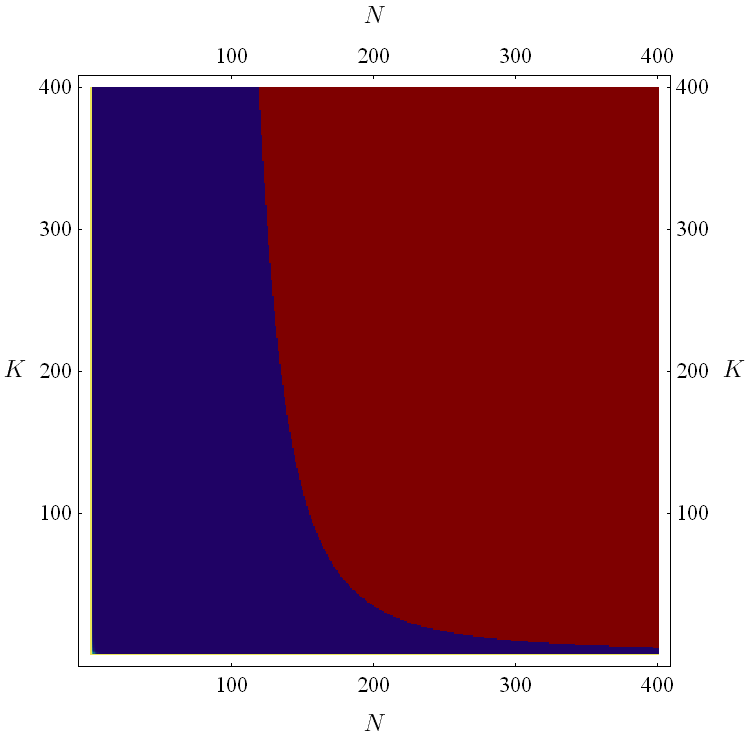
Wait... what on Earth? That hideous red color certainly isn't part of the "BlueGreenYellow" ColorFunction! Where could it possibly be coming from?
Upon closer inspection, I'm still not entirely sure what's going wrong here. Perhaps I have hit a computational limitation of Mathematica? The color should obviously be dark blue where that red pops up because my function evaluates to a very small number. But perhaps Mathematica is giving up on the evaluation altogether and just replaces the parts where it gave up with that color. I'm honestly not sure. Either way, that hideous red color is consistent regardless of the color scheme that I use. For example, with DarkRainbow:

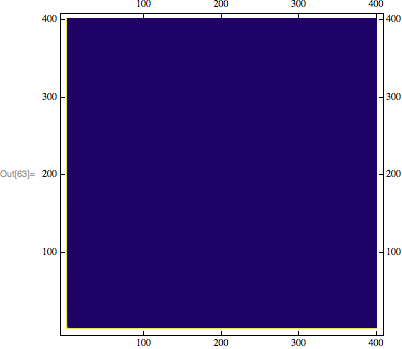
It's the exact same shade of red. Ideally, I would be able to control this color in some fashion; preferably I could change it to a dark blue. But most importantly, what exactly is going on here? Is it possible to change this dark red color?


N@Table[...], i.e. applyNto your data. Currently, you're passing an exact expression for a very, very small number to the color function. I don't think there is any good reason for why this shouldn't work, but it may be related to the problem somehow. (To see this expression, evaluateMin@Table[nd[1, 1, K, n], {K, 1, 400}, {n, 1, 400}].) Further evidence that it is related to the problem: If you try to pass that value toColorData["BlueGreenYellow", min value here], then it won't recognize it as a number and won't return a color. $\endgroup$