Let's say I have an arbitrary plot, for example a plot of a finite points that I colored them by my own taste independent of any formula like $f(x,y)$ or density etc. Or I have several plots and then I use the Show command to display them in the same plot. Now I want to add a colorbar, of course I have to use the BarLegend option. But now here is what I couldn't get from the help pages of Mathematica. How can I tell Mathematica that I want my colorbar starts from a specific color and ends to a specific color and varies in between the way I specify. For example I want to force it to be defined by RGBColor[i,0,1-i] where i is varying from 0 to 1 and then I also want to have different numbers than 0 and 1 as minimum and maximum numbers in the colorbar. My main problem is to tell colorbar to vary according to RGBColor[i,0,1-i]. In the help pages they refer to each other, BarLegend to ColorFunction and from there to some others and it is confusing to me. The examples listed there also use predefined color gradients such as visible, hue, etc. What about I just simply want to have a function like i->RGBColor[i,0,1-i] or maybe later a piecewise defined function that varies the same way I described but between several colors. I guess it shouldn't be something complicated, but anyway the help pages made me more confused. Thanks for any help.
1 Answer
I'll try to answer the questions in your comments. First question, why the scaling is different when BarLegend is used inside ListPlot and separately. The documentation does not say much about this, other than a very vague remark in the Scope -> PlotLegends section of the BarLegend documentation page:
BarLegend automatically picks up values of ColorFunction and ColorFunctionScaling
So there is an interplay between BarLegend and plotting functions, although it isn't clearly described exactly how it works.
In any case, this example shows what is happening:
BarLegend[{
  Blend[{
     {0, RGBColor[0, 0, 1]},
     {0.13^2, RGBColor[1, 0, 0]}
     }, #] &,
  {0, 0.13}
  }]
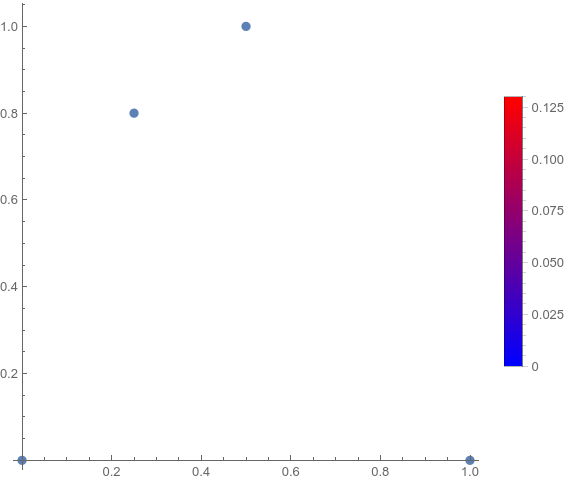
This output matches what the bar legend looks like inside ListPlot. Consequently, what is happening is that when you first say that the domain of the bar legend is [0, 0.13] and then also say that the color function should blend between 0 and 0.13, the result is that the color is blended over [0, 0.13^2].
A simple way to avoid this is to not specify the scaling both in BarLegend and in Blend:
pts = {{0, 0}, {1/2, 1}, {1/4, 4/5}, {1, 0}};
cf = Blend[{
     RGBColor[0, 0, 1],
     RGBColor[1, 0, 0]
     }, #] &;
ListPlot[
 pts,
 PlotStyle -> PointSize[Large],
 AspectRatio -> 1,
 PlotLegends -> BarLegend[{cf, {0, 0.13}}]
 ]
Another way is to set ColorFunctionScaling -> False because then it seems that the independence of BarLegend against ListPlot is regained:
cf = Blend[{
     {0, RGBColor[0, 0, 1]},
     {0.13, RGBColor[1, 0, 0]}
     }, #] &;
ListPlot[
 pts,
 PlotStyle -> PointSize[Large],
 AspectRatio -> 1,
 ColorFunctionScaling -> False,
 PlotLegends -> BarLegend[{cf, {0, 0.13}}]
 ]
As for the example with PlotLegends in Show, I'm not sure that this is supported. The arguments acceptable to Show are, at least generally speaking, those acceptable to Graphics, and I don't see PlotLegends among the options in the documentation for Graphics. Furthermore, it might be that since the plot range, image padding, image margins etc. are determined by the argument of Show, any subsequently added plot legend might appear out of view. However, I tried playing with those options and so far as I can tell this is not the case. The best solution is probably to stick your plot legend into a plot.
-
$\begingroup$ Thanks for your complete and nice explanation. For the second part, Adding the colorbar to only one of the plots in the list and then using Show will provide what I want (adding to show doesn't work, adding to each plot will create many colorbars to the result of Show, but adding to only one of them, will give the expected result). Thanks again for your help.:) $\endgroup$ Commented Jun 21, 2020 at 12:27


minmax = {.3, .9}; BarLegend[{RGBColor[#, 0, 1 - #] &, minmax}]orBarLegend[{RGBColor[#, 0, 1 - #] &@Rescale[#, minmax] &, minmax}]give what you need? $\endgroup$Blend. $\endgroup$BarLegend[{Blend[{{0, RGBColor[0, 0, 1]}, {0.13, RGBColor[1, 0, 0]}}, #] &, {0, 0.13}}]alone is working fine, butListPlot[{{0, 0}, {1/2, 1}, {1/4, 4/5}, {1, 0}}, PlotStyle -> Directive[RGBColor[1, 0, 1], PointSize[0.02]], AspectRatio -> 1, PlotLegends -> BarLegend[{Blend[{{0, RGBColor[0, 0, 1]}, {0.13, RGBColor[1, 0, 0]}},#] &, {0, 0.13}}]]has a problem in color scaling. Do you know why? $\endgroup$Show[plist, PlotLegends -> BarLegend[{Blend[{{0, RGBColor[0, 0, 1]}, {0.13, RGBColor[1, 0, 0]}},#] &, {0, 0.13}}]]:( $\endgroup$