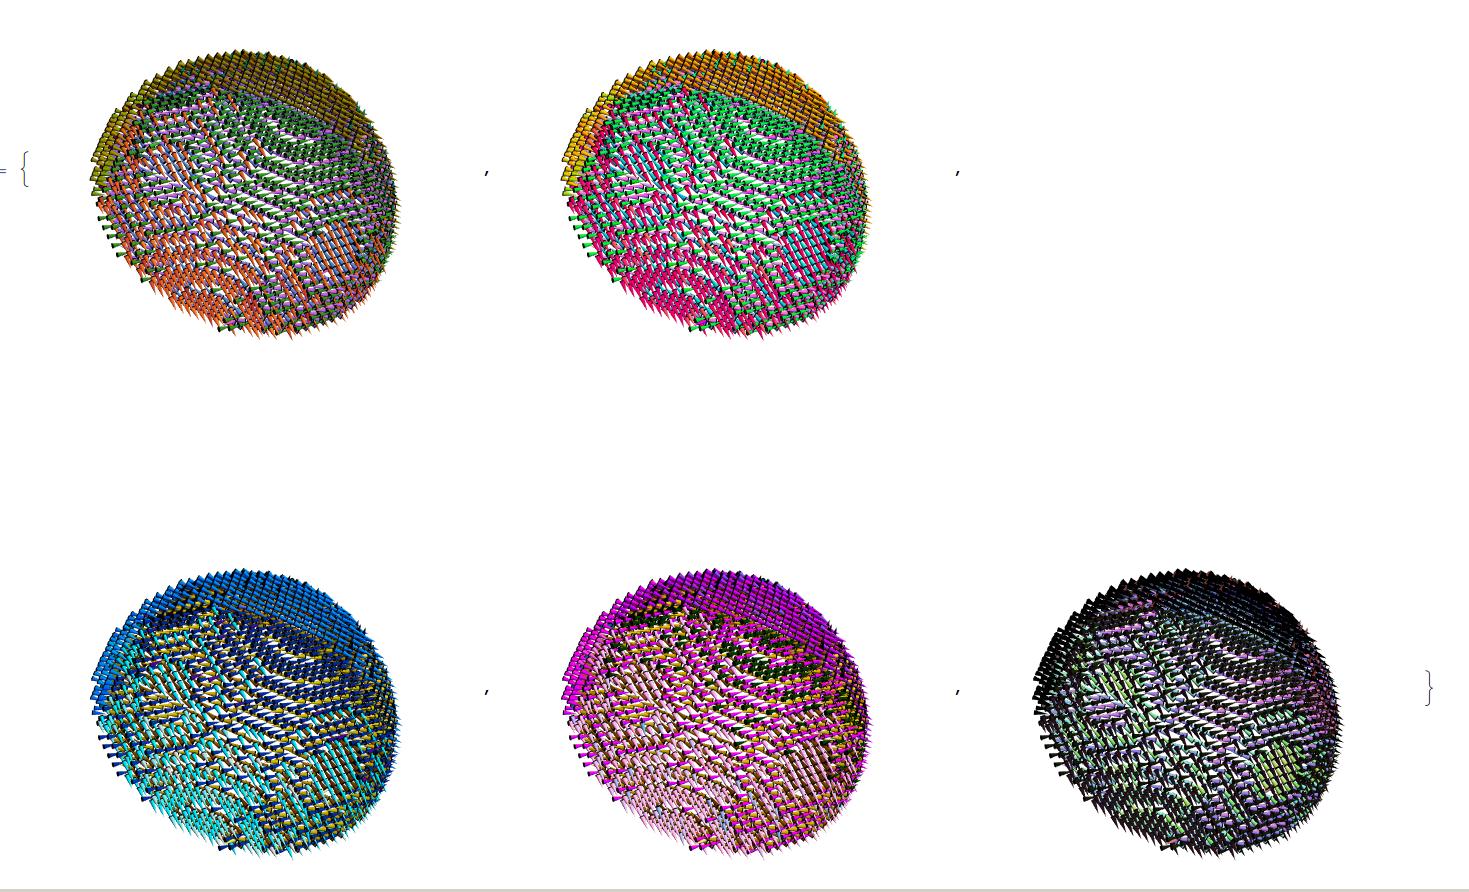
You want to color the cones depending upon their orientation, which is a three-dimensional property. One way to do this would be to supply scaled versions of the Cartesian components of the orientation to some of the color space functions available.
First step is to import the data, and create a list containing the cone vectors and the rescaled orientation vectors,
data = Import["~/Downloads/Example.nba", "Table"];
h2 = 0.7; h1 = 0.0;
conespec = {(h2 - h1)*#6 + h1, {Cos[#2]*Sin[#1], Sin[#2]*Sin[#1],
      Cos[#1]}, {#3, #4, #5}} & @@@ data[[All, 6 ;; 11]];
conespec2 = {(#3 - 0.9 #2), (#3 + 0.9 #2)} & @@@ conespec;
rescaledorientations =
  Transpose[Rescale /@ Transpose[First@*Differences /@ conespec2]];
conespec2 =
  Transpose[Catenate[Transpose /@ {conespec2, rescaledorientations}]];
Now you can use one of the built-in color spaces like this,
Function[colorspace,
  Graphics3D[{colorspace[#3, #4, #5], Cone[{#1, #2}, 0.3]} & @@@
    conespec2, Boxed -> False, ImageSize -> 300,
   ViewPoint -> {2.3, 2.3, .3},
   ViewVertical -> {0, 2, .4}]] /@
 {RGBColor,
  XYZColor,
  LABColor[#1, Rescale[#2, {0, 1}, {-1, 1}],
    Rescale[#3, {0, 1}, {-1, 1}]] &,
  LUVColor[#1, Rescale[#2, {0, 1}, {-1, 2}],
    Rescale[#3, {0, 1}, {-1.5, 1}]] &,
  Hue
  }

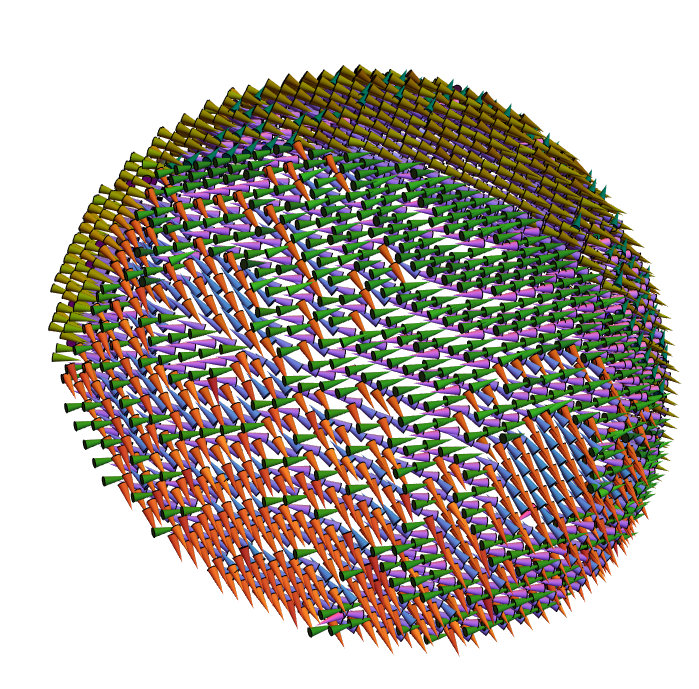
Here is a closer version of the first image,using RGBColor,

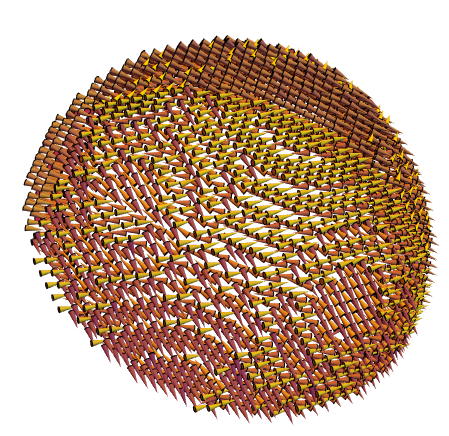
What's that you say? You want more control over the color distribution? Well you can make a 3-argument version of Blend quite easily,
Graphics3D[{Blend[{Purple, Yellow, Orange}, {#3, #4, .5 #5}],
    Cone[{#1, #2}, 0.3]} & @@@ conespec2, Boxed -> False,
 ImageSize -> 600, ViewPoint -> {2.3, 2.3, .3},
 ViewVertical -> {0, 2, .4}]

You may notice that most of the colors are pretty similar, and don't match the pure colors supplied to Blend, that is because of the way your orientations are distributed,
Histogram /@ Transpose[rescaledorientations]

You could apply some sort of RotationTransform to the vectors before applying Rescale as above if you wish.


Graphics3D[{EdgeForm[ColorData["TemperatureMap"][#1]], ColorData["TemperatureMap"][#1], Cone[{#3 - 0.9 #2, #3 + 0.9 #2}, 0.3]} & @@@conespec, Boxed -> False, ImageSize -> 600]? $\endgroup$