2
$\begingroup$

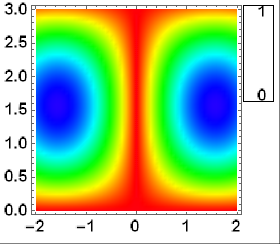
How I can use Hue as color function in BarLegend in this density plot?

ShowLegend[
 DensityPlot[1 - Abs[Sin[x] Sin[y]], {x, -2, 2}, {y, 0, 3}, 
  PlotRange -> All, ImageSize -> 280, AspectRatio -> 1, 
  LabelStyle -> {FontSize -> 17, Black, Bold}, Frame -> True, 
  ColorFunction -> (Hue[1 - (0.7 # + 0.31)] &), 
  ColorFunctionScaling -> False, 
  PlotPoints -> 50], {ColorData[(Hue[1 - (0.7 # + 0.31)] &)] &, 10, 
  " 1", " 0", LegendPosition -> {1, 0.15}, 
  BaseStyle -> {FontSize -> 16, Bold, Black}, LegendShadow -> None}]
enter image description here

$\endgroup$
2
  • 1
    $\begingroup$ Try DensityPlot only with PlotLegends -> Automatic. MMA V10.2 $\endgroup$ Commented Dec 7, 2015 at 1:17
  • $\begingroup$ It is difficult to control the position and the size of the barlegend using Plotlegend? $\endgroup$
    – MMA13
    Commented Dec 7, 2015 at 1:27

2 Answers 2

1
$\begingroup$

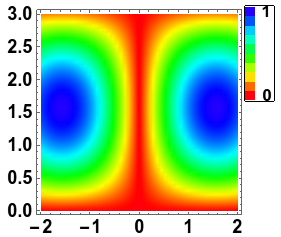
I agree with others that you can have all the functionality without using the old PlotLegends package, I'd be interested in knowing if there are any options you want to add but cannot. That being said, you can get Hue to work with ShowLegend easily enough. You just had the color function formatted improperly. There's no reason to wrap Hue with ColorDataFunction

ShowLegend[
 DensityPlot[1 - Abs[Sin[x] Sin[y]], {x, -2, 2}, {y, 0, 3}, 
  PlotRange -> All, ImageSize -> 280, AspectRatio -> 1, 
  LabelStyle -> {FontSize -> 17, Black, Bold}, Frame -> True, 
  ColorFunction -> (Hue[1 - (0.7 # + 0.31)] &), 
  ColorFunctionScaling -> False, 
  PlotPoints -> 50], {(Hue[1 - (0.7 # + 0.31)] &), 10, " 1", " 0", 
  LegendPosition -> {1, 0.15}, 
  BaseStyle -> {FontSize -> 16, Bold, Black}, LegendShadow -> None}]
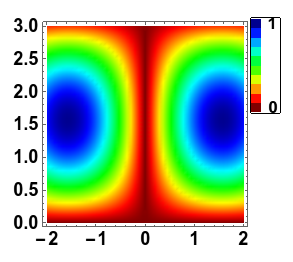
enter image description here

By the way, it looks like you are trying to recreate the MATLAB Jet color scheme by restricting the Hue values to between 0 and 0.7. You can also use a Jet-like color scheme directly, which I've defined in this pastebin:

<< "http://pastebin.com/raw.php?i=Dgck3tBL";
ShowLegend[
 DensityPlot[1 - Abs[Sin[x] Sin[y]], {x, -2, 2}, {y, 0, 3}, 
  PlotRange -> All, ImageSize -> 280, AspectRatio -> 1, 
  LabelStyle -> {FontSize -> 17, Black, Bold}, Frame -> True, 
  ColorFunction -> JetCM, ColorFunctionScaling -> False, 
  PlotPoints -> 50], {JetCM, 10, " 1", " 0", 
  LegendPosition -> {1, 0.15}, 
  BaseStyle -> {FontSize -> 16, Bold, Black}, LegendShadow -> None}]

enter image description here

$\endgroup$
4
  • $\begingroup$ I like the last one:-) $\endgroup$
    – MMA13
    Commented Dec 7, 2015 at 21:15
  • $\begingroup$ Yes, exactly, I want to create MATLAB Jet color scheme by restricting the Hue values to be between 0 and 1. $\endgroup$
    – MMA13
    Commented Dec 7, 2015 at 21:24
  • $\begingroup$ A former coworker of mine took the jet color scheme and extracted the RGB values, and I made the JetCM color function from it. $\endgroup$
    – Jason B.
    Commented Dec 7, 2015 at 21:27
  • 1
    $\begingroup$ Here are other options. mathematica.stackexchange.com/a/64514/9490 $\endgroup$
    – Jason B.
    Commented Dec 7, 2015 at 21:28
1
$\begingroup$

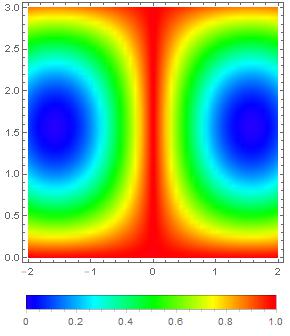
For example

DensityPlot[
 1 - Abs[Sin[x] Sin[y]], {x, -2, 2}, {y, 0, 3},
 ImageSize -> 280,
 ColorFunction -> (Hue[1 - (0.7 # + 0.31)] &),
 PlotLegends -> Placed[Automatic, Below],
 PlotPoints -> 50]

enter image description here

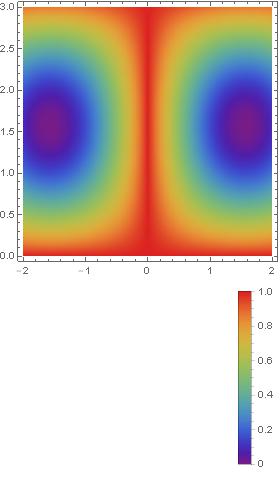
DensityPlot[
 1 - Abs[Sin[x] Sin[y]], {x, -2, 2}, {y, 0, 3},
 ImageSize -> 280,
 ColorFunction -> "Rainbow",
 PlotLegends -> 
  Placed[BarLegend[{"Rainbow", {0, 1}}, 
    LegendMarkerSize -> 200], {{1, 0}, {1, 1}}],
 PlotPoints -> 50]

enter image description here

$\endgroup$
1
  • $\begingroup$ using plotlegend is not helping to make the plot consistant with the barlegend, showlegend provide many options. I would like to know if there is a way to use a desired color with ColorData apart from "Rinbow", "TemperatureMap", SunsetColors, and ...etc $\endgroup$
    – MMA13
    Commented Dec 7, 2015 at 2:02

Your Answer

By clicking “Post Your Answer”, you agree to our terms of service and acknowledge you have read our privacy policy.

Not the answer you're looking for? Browse other questions tagged or ask your own question.