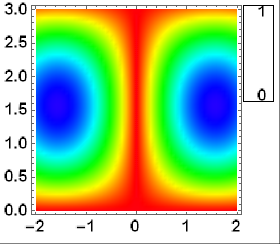
How I can use "Hue" colorfunction in the barLegendHue as color function in BarLegend in this exampledensity plot?
ShowLegend[
 DensityPlot[1 - Abs[Sin[x] Sin[y]], {x, -2, 2}, {y, 0, 3},
  PlotRange -> All, ImageSize -> 280, AspectRatio -> 1,
  LabelStyle -> {FontSize -> 17, Black, Bold}, Frame -> True,
  ColorFunction -> (Hue[1 - (0.7 # + 0.31)] &),
  ColorFunctionScaling -> False,
  PlotPoints -> 50], {ColorData[(Hue[1 - (0.7 # + 0.31)] &)] &, 10,
  " 1", " 0", LegendPosition -> {1, 0.15},
  BaseStyle -> {FontSize -> 16, Bold, Black}, LegendShadow -> None}]
ShowLegend[
 DensityPlot[1 - Abs[Sin[x] Sin[y]], {x, -2, 2}, {y, 0, 3},
  PlotRange -> All, ImageSize -> 280, AspectRatio -> 1,
  LabelStyle -> {FontSize -> 17, Black, Bold}, Frame -> True,
  ColorFunction -> (Hue[1 - (0.7 # + 0.31)] &),
  ColorFunctionScaling -> False,
  PlotPoints -> 50], {ColorData[(Hue[1 - (0.7 # + 0.31)] &)] &, 10,
  " 1", " 0", LegendPosition -> {1, 0.15},
  BaseStyle -> {FontSize -> 16, Bold, Black}, LegendShadow -> None}]

