3
$\begingroup$

I have a noise image (8bit, gray scale): https://i.sstatic.net/RIgOk.png

The following code:

image = Import["https://i.sstatic.net/RIgOk.png", "PNG"];

imageData = N@ImageData[image, "Byte"];

colTable = {Red, Green, Blue};

plot = ArrayPlot[imageData, ColorFunction -> (Blend[colTable, #] &), 
  PlotLegends -> Automatic, FrameTicks -> All, ImageSize -> Medium]

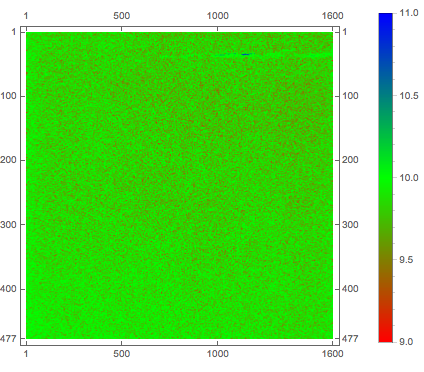
produces an ArrayPlot:

enter image description here

I have two questions:

1. How can I change the vertical extension of the color legend, so that it as high as the plot is.

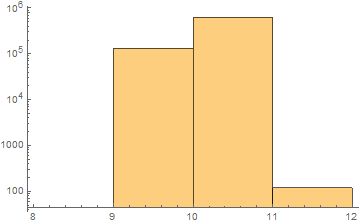
2. The image contains only Byte values of 9,10,11:

Histogram[Flatten@imageData, ScalingFunctions -> "Log", 
 ImageSize -> Medium]

enter image description here

How can I use my upper color table which only consist of 3 colors instead of smoothing in between?

$\endgroup$
1

3 Answers 3

5
$\begingroup$

A couple of ideas here. First, as J.M. commented above, you could use exact (Integer) values and ColorRules:

imageData = ImageData[image, "Byte"];

ArrayPlot[imageData
 , ColorRules  -> Thread[{9, 10, 11} -> colTable]
 , PlotLegends -> Automatic
 , FrameTicks  -> All
 , ImageSize   -> Medium
]

enter image description here

That handily solves your legend size issue as well, at least for this case.

If that is not what you want you could use a color function like colTable[[⌈3 #⌉]] & to select the color you want. The legend can easily be resized by hand (just click it and drag the corners of the orange frame that appears).

ArrayPlot[imageData
  , ColorFunction -> (colTable[[⌈3 #⌉]] &)
  , PlotLegends   -> Automatic
  , FrameTicks    -> All
  , ImageSize     -> Medium
]

Finally with rcollyer's assistance I learned that we need to specify an explicit AspectRatio to get correct autosizing of the legend in this case:

ArrayPlot[imageData
  , ColorFunction -> (colTable[[⌈3 #⌉]] &)
  , PlotLegends   -> Placed[Automatic, Right]
  , FrameTicks    -> All
  , ImageSize     -> Medium
  , AspectRatio   -> 1/3
]

enter image description here

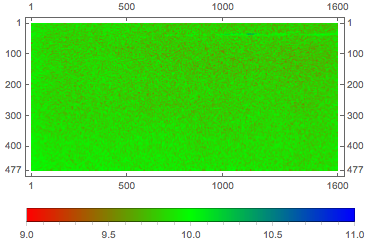
Incorporating an additional detail from the comments, we can set the range of the legend bar like this:

ArrayPlot[imageData
  , ColorFunction -> (colTable[[⌈3 #⌉]] &)
  , PlotLegends   -> Placed[BarLegend[{Automatic, {9, 12}}], Right]
  , FrameTicks    -> All
  , ImageSize     -> Medium
  , AspectRatio   -> 1/3
]

enter image description here

$\endgroup$
4
  • $\begingroup$ Great .. thanks. Is it possible the red goes from 9 to 10, green from 10 to 11 and red from 11 to 12? Or everything can be shifted by -0.5 ... In your legend each color extends over about 0.6. $\endgroup$
    – mrz
    Commented Aug 5, 2016 at 16:17
  • $\begingroup$ @mrz Good point. Let me see what I can do about that. Also, thanks for the Accept. $\endgroup$
    – Mr.Wizard
    Commented Aug 5, 2016 at 19:14
  • $\begingroup$ @mrz It looks like PlotLegends -> BarLegend[{Automatic, {9, 12}}] will be the easiest way to achieve that. This can be combined with Placed: Placed[BarLegend[{Automatic, {9, 12}}], Right] $\endgroup$
    – Mr.Wizard
    Commented Aug 5, 2016 at 19:23
  • $\begingroup$ Perfect ... that's it $\endgroup$
    – mrz
    Commented Aug 5, 2016 at 19:40
5
$\begingroup$

Try this:

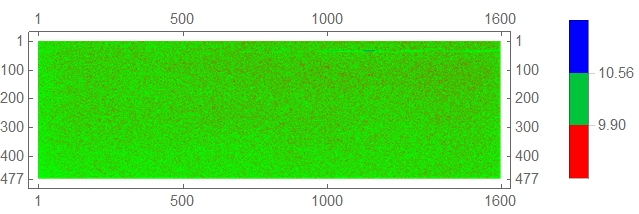
    plot = ArrayPlot[imageData, ColorFunction -> (Blend[colTable, #] &), 
  PlotLegends -> BarLegend[Automatic, 2, LegendMarkerSize -> 125], 
  FrameTicks -> All, ImageSize -> Medium]

with the effect:

enter image description here

or this:

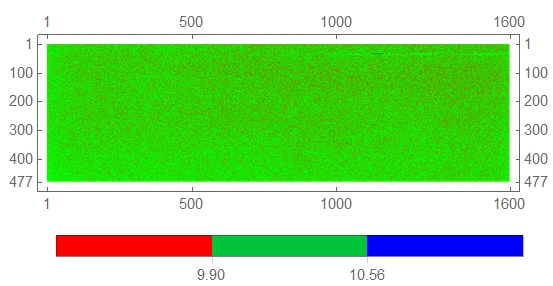
     plot = ArrayPlot[imageData, ColorFunction -> (Blend[colTable, #] &), 
      PlotLegends ->Placed[BarLegend[Automatic, 2, LegendMarkerSize -> 340], Below], 
FrameTicks -> All, ImageSize -> Medium]

yielding the following

enter image description here

Have fun!

$\endgroup$
7
  • $\begingroup$ Is there some way to automatically set the legend size or LegendMarkerSize? I have been working on that for the last few minutes to no avail. $\endgroup$
    – Mr.Wizard
    Commented Aug 5, 2016 at 12:55
  • $\begingroup$ @Mr.Wizard it is being automatically set, ImageSize is translated to LegendMarkerSize. $\endgroup$
    – rcollyer
    Commented Aug 5, 2016 at 12:58
  • $\begingroup$ @Mr.Wizard Not that I know. $\endgroup$ Commented Aug 5, 2016 at 12:59
  • $\begingroup$ @Mr.Wizard the issue is the AspectRatio of the image is "funny", so the height is being taken into account as well as it should. $\endgroup$
    – rcollyer
    Commented Aug 5, 2016 at 13:01
  • 2
    $\begingroup$ @Mr.Wizard LegendMarkerSize -> Automatic (the default) is supposed to pick up the ImageSize. But, ArrayPlot is producing something where the vertical and horizontal dimensions differ quite a bit, so the legend is much larger than it should be. You can trick it by setting an AspectRatio. $\endgroup$
    – rcollyer
    Commented Aug 5, 2016 at 13:06
4
$\begingroup$

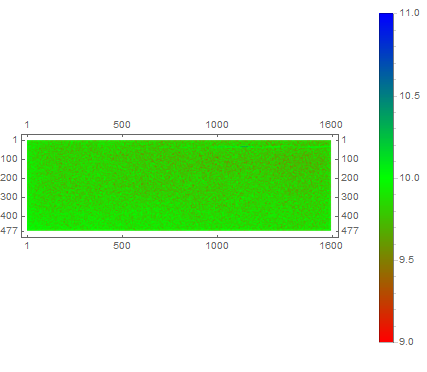
Personally, I think using ColorRules is the best option. But, in case you want to use ColorFunction (with the resulting BarLegend), I would suggest setting the AspectRatio, too, e.g.

ArrayPlot[imageData, ColorFunction -> (Blend[colTable, #] &), 
 PlotLegends -> Automatic, ImageSize -> Medium, FrameTicks -> All, 
 AspectRatio -> 1/2]

enter image description here

Or you could set it to 1

ArrayPlot[imageData, ColorFunction -> (Blend[colTable, #] &), 
 PlotLegends -> Automatic, ImageSize -> Medium, FrameTicks -> All, 
 AspectRatio -> 1]

enter image description here

Although, I prefer 1/2.

$\endgroup$
1
  • $\begingroup$ Oh, so that's how it is done. What I was looking for: ArrayPlot[imageData, ColorFunction -> (Blend[colTable, #] &), PlotLegends -> Placed[Automatic, Right], ImageSize -> Medium, FrameTicks -> All, AspectRatio -> 1/2] $\endgroup$
    – Mr.Wizard
    Commented Aug 5, 2016 at 13:10

Your Answer

By clicking “Post Your Answer”, you agree to our terms of service and acknowledge you have read our privacy policy.

Not the answer you're looking for? Browse other questions tagged or ask your own question.