7
$\begingroup$

The following two examples work

ContourPlot[Exp[-x^2 - y^2], {x, -2, 2}, {y, -2, 2}, 
ColorFunction -> ColorData[{"TemperatureMap", {0, 1}}]]
ContourPlot[Exp[-x^2 - y^2], {x, -2, 2}, {y, -2, 2},
ColorFunction -> ColorData[{"TemperatureMap", "Reverse"}]]

I want to combine those two options, but the following does not work

ContourPlot[Exp[-x^2 - y^2], {x, -2, 2}, {y, -2, 2}, 
ColorFunction -> ColorData[{"TemperatureMap", "Reverse", {1, 0}}]]  

The last plot is just black and I get the message

ColorData::notent: {TemperatureMap, Reverse, {1, 0}} is not a known entity,
class, or tag for ColorData. Use ColorData[] for a list of entities."

The above is just some minimum working example, and if you wonder why I want to do this, read the following: I am making several contourplots that I want to have the same color representing the same values, so I need to specify the values. I also have one set of plots that go from negative to 0, and one set that goes from 0 to some positive value. In the negative case the most negative value represents the largest effect, while in the positive case the most positive value represents the largest effect. I want largest effect in both cases to have the deepest color, so I need to invert one of the colorgradients.

Help is much appreciated.

enter image description here

Edit

I was a bit unclear earlier, but I'll try to calrify now. I have made some more plots to illustrate what I mean. Sorry for the lengthy code.

myColRange[range_] := ColorData[{"StarryNightColors", range}];
cont = 15;

GraphicsGrid[{{

   ContourPlot[
    -Exp[-x^2 - y^2], {x, -2, 2}, {y, -2, 2},
     ColorFunction -> myColRange[{-3, 0}],
    ColorFunctionScaling -> False,
    Contours -> cont,
    PlotLabel -> 
   "-\!\(\*SuperscriptBox[\(e\), \(\(-\*SuperscriptBox[\(x\), \
   \(2\)]\) - \*SuperscriptBox[\(y\), \(2\)]\)]\)"],

   Plot3D[
    -Exp[-x^2 - y^2], {x, -2, 2}, {y, -2, 2},
    ColorFunction -> myColRange[{-3, 0}],
    ColorFunctionScaling -> False,
    PlotRange -> {{-2, 2}, {-2, 2}, {-3, 0}},
    PlotLabel -> 
     "-\!\(\*SuperscriptBox[\(e\), \(\(-\*SuperscriptBox[\(x\), \
     \(2\)]\) - \*SuperscriptBox[\(y\), \(2\)]\)]\)"],

   ContourPlot[
    -3 Exp[-x^2 - y^2], {x, -2, 2}, {y, -2, 2},
    ColorFunction -> myColRange[{-3, 0}],
    ColorFunctionScaling -> False,
    Contours -> cont,
    PlotLabel -> 
      "-3\!\(\*SuperscriptBox[\(e\), \(\(-\*SuperscriptBox[\(x\), \
      \(2\)]\) - \*SuperscriptBox[\(y\), \(2\)]\)]\)"],

   Plot3D[
    -3 Exp[-x^2 - y^2], {x, -2, 2}, {y, -2, 2},
    ColorFunction -> myColRange[{-3, 0}],
    ColorFunctionScaling -> False,
    PlotRange -> {{-2, 2}, {-2, 2}, {-3, 0}},
    PlotLabel -> 
      "-3\!\(\*SuperscriptBox[\(e\), \(\(-\*SuperscriptBox[\(x\), \
      \(2\)]\) - \*SuperscriptBox[\(y\), \(2\)]\)]\)"]},

  {ContourPlot[
    Exp[-x^2 - y^2], {x, -2, 2}, {y, -2, 2},
    ColorFunction -> myColRange[{0, 3}],
    ColorFunctionScaling -> False, Contours -> cont,
    PlotLabel -> 
     "\!\(\*SuperscriptBox[\(e\), \(\(-\*SuperscriptBox[\(x\), \(2\)]\
     \) - \*SuperscriptBox[\(y\), \(2\)]\)]\)"],

   Plot3D[
    Exp[-x^2 - y^2], {x, -2, 2}, {y, -2, 2},
    ColorFunction -> myColRange[{0, 3}],
    ColorFunctionScaling -> False,
    PlotRange -> {{-2, 2}, {-2, 2}, {0, 3}},
    PlotLabel -> 
     "\!\(\*SuperscriptBox[\(e\), \(\(-\*SuperscriptBox[\(x\), \(2\)]\
      \) - \*SuperscriptBox[\(y\), \(2\)]\)]\)"],

   ContourPlot[
    3 Exp[-x^2 - y^2], {x, -2, 2}, {y, -2, 2},
    ColorFunction -> myColRange[{0, 3}],
    ColorFunctionScaling -> False, Contours -> cont,
    PlotLabel -> 
     "3\!\(\*SuperscriptBox[\(e\), \(\(-\*SuperscriptBox[\(x\), \
       \(2\)]\) - \*SuperscriptBox[\(y\), \(2\)]\)]\)"],

   Plot3D[
    3 Exp[-x^2 - y^2], {x, -2, 2}, {y, -2, 2},
    ColorFunction -> myColRange[{0, 3}],
    ColorFunctionScaling -> False,
    PlotRange -> {{-2, 2}, {-2, 2}, {0, 3}},
    PlotLabel -> 
     "3\!\(\*SuperscriptBox[\(e\), \(\(-\*SuperscriptBox[\(x\), \
      \(2\)]\) - \*SuperscriptBox[\(y\), \(2\)]\)]\)"]}},

 ImageSize -> Large]

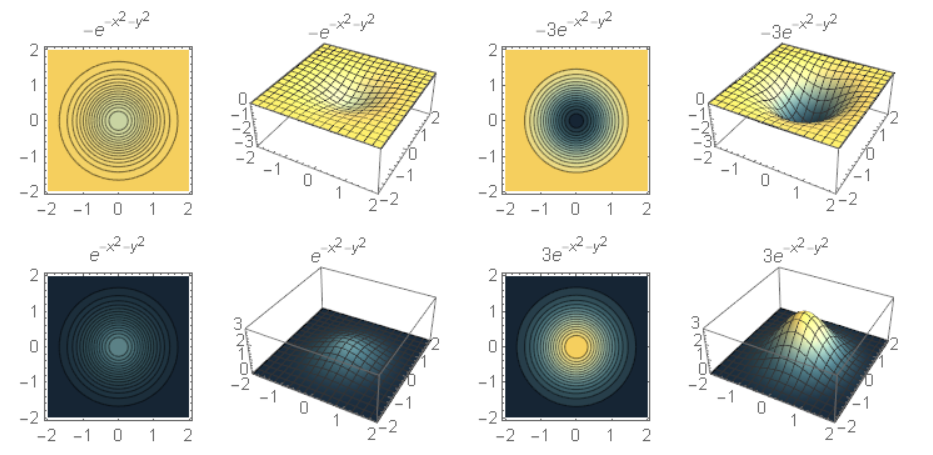
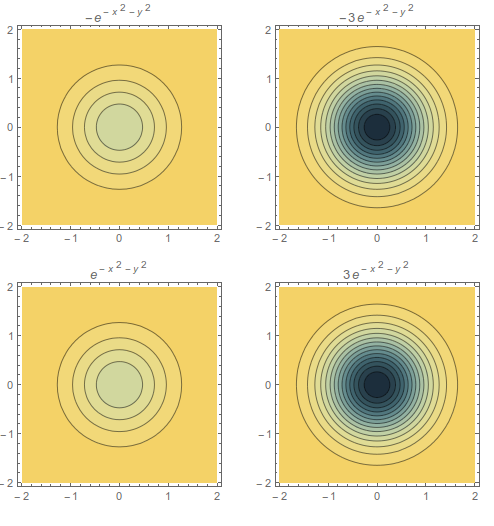
The code generates these plots

I am interested in the contourplots, but included the 3D plots to better illustrate what I want.

If you look at one row, the plots have the same range. In the first row the colors changes from -3 to 0, and in the second from 0 to 3. I want to keep it like that: plots in a row have the same scale on the colordata. The scale does not need to be the same for the two different rows, they just happen to be 0 and |3| here because I copy pasted.

What I want now is to reverse the colors of the positive plots in row 2, but I would like to keep the shape of the plot. So I want the peaks to be dark, and then grow lighter closer to 0.

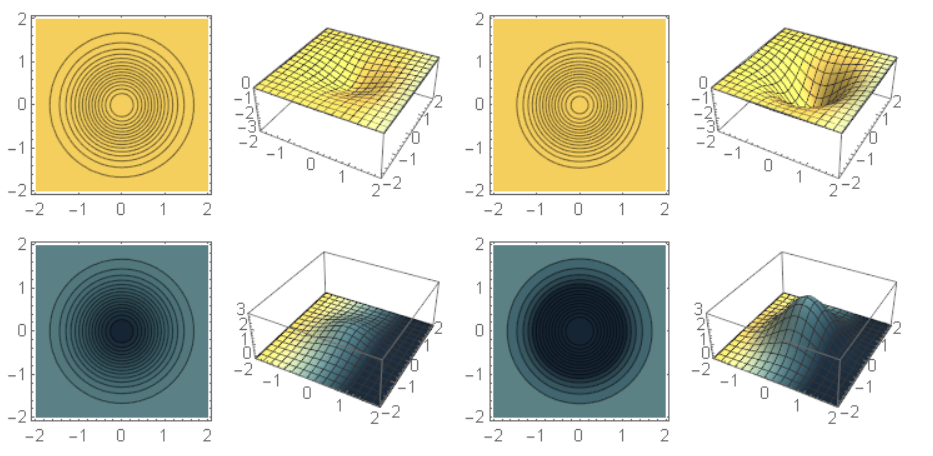
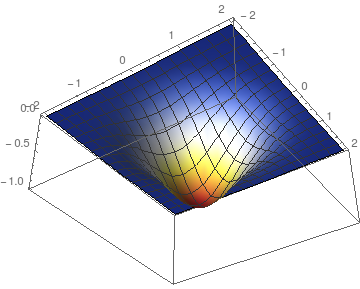
I tried with the pure function proposed by JasonB, but then I get this

 myColPure[range_] := (ColorData[{"StarryNightColors", range}][1 - #] &)

enter image description here

$\endgroup$
2
  • $\begingroup$ @JasonB Sorry, I just realized i copied the wrong code! I have edited my question now. My question was supposed to be for contourplots, and I can't get your answers to work for them. They worked perfectly for Plot3D tho :) $\endgroup$
    – Espen Brun
    Commented Feb 11, 2016 at 10:38
  • $\begingroup$ The difference between the color function for Plot3D and for ContourPlot is that with ContourPlot only one possible value is fed to the color function, the contour level. For Plot3D it can be given the x, y, or z values and you need to use the 3rd slot to scale it with the z value, so just # for ContourPlot and #3 for Plot3D $\endgroup$
    – Jason B.
    Commented Feb 11, 2016 at 10:56

3 Answers 3

6
$\begingroup$

I think everyone is overlooking the simplest way:

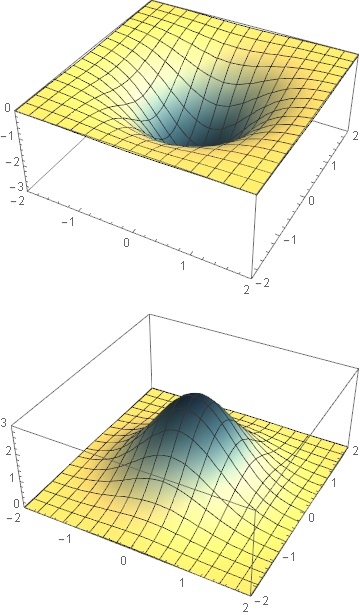
  • If you want a range of {0, 3} but also reversed, just specify it as {3, 0}:

:-) Magic:

Plot3D[-3 Exp[-x^2 - y^2], {x, -2, 2}, {y, -2, 2},
 ColorFunction -> ColorData[{"StarryNightColors", {-3, 0}}],
 ColorFunctionScaling -> False,
 PlotRange -> {{-2, 2}, {-2, 2}, {-3, 0}}
]

Plot3D[3 Exp[-x^2 - y^2], {x, -2, 2}, {y, -2, 2},
 ColorFunction -> ColorData[{"StarryNightColors", {3, 0}}],
 ColorFunctionScaling -> False,
 PlotRange -> {{-2, 2}, {-2, 2}, {0, 3}}
]

enter image description here

$\endgroup$
3
  • $\begingroup$ Nice, that is a bit embarrassing to have overlooked that :-) $\endgroup$
    – Jason B.
    Commented Feb 13, 2016 at 6:05
  • $\begingroup$ Wow yes this is a bit simpler :) $\endgroup$
    – Espen Brun
    Commented Feb 17, 2016 at 11:00
  • $\begingroup$ @EspenBrun Thanks for the Accept. $\endgroup$
    – Mr.Wizard
    Commented Feb 17, 2016 at 13:01
4
$\begingroup$

You have another problem that you haven't considered: Plotting-functions like Plot3D will scale their values. So if you have as example, all negative values like here

Plot3D[-Exp[-x^2 - y^2], {x, -2, 2}, {y, -2, 2}, 
 ColorFunction -> ColorData[{"TemperatureMap", {0, 1}}]]

gr

The plot will still be colored, although you explicitly specified the range to be {0,1}. Therefore, if you need to work with values directly from the surface, then you need to specify ColorFunctionScaling->False.

The rest can be done by simply making your own function from ColorData. Jason already showed how to do this with anonymous functions. Let me show the explicit way:

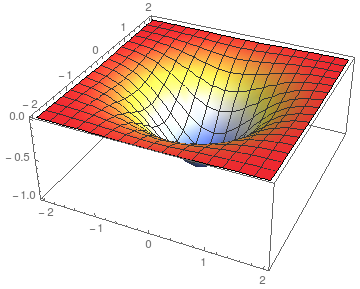
myColAbs[val_] := ColorData["TemperatureMap"][Abs[val]]

Plot3D[-Exp[-x^2 - y^2], {x, -2, 2}, {y, -2, 2}, 
 ColorFunction -> myColAbs,
 ColorFunctionScaling -> False
]

et voila:

Mathematica graphics

$\endgroup$
1
  • $\begingroup$ Thanks for the insight regarding the pure function and ColorFunctionScaling -> False got me one step closer. I was a bit unclear in my post what i really wanted though, so I have edited it again. $\endgroup$
    – Espen Brun
    Commented Feb 11, 2016 at 16:11
4
$\begingroup$

It doesn't seem as though you can specify more than one property for a ColorData object. So if you want to reverse it the order of the colors, you can do that with the "Reverse" property, and you can reverse the range by applying a pure function to the inputs.

Change your color function to this:

myColRange[range_] := 
  Function[x, 
   ColorData[{"StarryNightColors", "Reversed"}][
    Rescale[Abs[x], range]]];

and also redefine your cont so that the lines are at the same levels for each plot (so they have a consistent meaning)

cont = Subdivide[-3, 3, 30];

and now your contour plots look like this:

enter image description here

$\endgroup$
7
  • $\begingroup$ This reverses the plot twice, right? Instead of having the "Reverse", I would like to give the range that the colors should be scaled to. I would like to have several contourplots, say Exp[-x^2 - y^2] 2 x Exp[-x^2 - y^2] 3 x Exp[-x^2 - y^2] I want the colors to represent the same values inn all three plots, so that the first will be more blue etc $\endgroup$
    – Espen Brun
    Commented Feb 11, 2016 at 11:10
  • $\begingroup$ Yeah, I'm still confused about what you want to do. What you wrote in your example, ColorFunction -> ColorData[{"TemperatureMap", "Reverse", {1, 0}}], if that worked that is exactly what it would do - it would reverse the color function twice. $\endgroup$
    – Jason B.
    Commented Feb 11, 2016 at 11:13
  • $\begingroup$ I think you just need to do what halirutan suggests, define the myColAbs and turn ColorFunctionScaling to False $\endgroup$
    – Jason B.
    Commented Feb 11, 2016 at 11:19
  • $\begingroup$ Thanks for your comments :) I have edited my post yet again to better illustrate what I mean, since I was pretty unclear. I tried to use your pure function, but I could not get it to work. $\endgroup$
    – Espen Brun
    Commented Feb 11, 2016 at 16:09
  • $\begingroup$ @EspenBrun let me know if that is what you needed. $\endgroup$
    – Jason B.
    Commented Feb 11, 2016 at 16:34

Your Answer

By clicking “Post Your Answer”, you agree to our terms of service and acknowledge you have read our privacy policy.

Not the answer you're looking for? Browse other questions tagged or ask your own question.