2
$\begingroup$

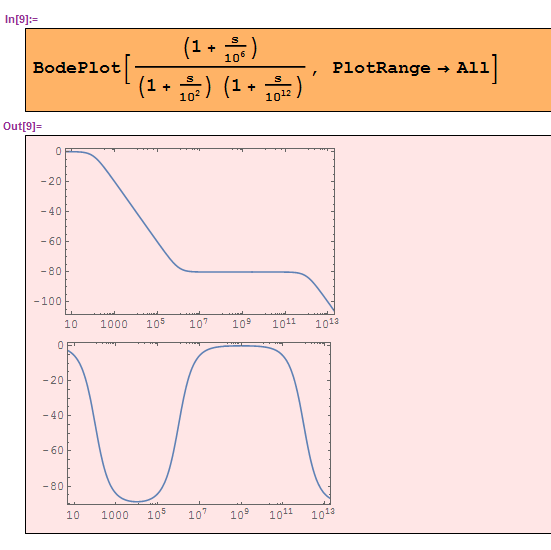
I am using the BodePlot function to plot magnitude and phase of the function below:

BodePlot[(1 + s/10^6)/((1 + s/10^2)*(1 + s/10^12)), PlotRange -> All]

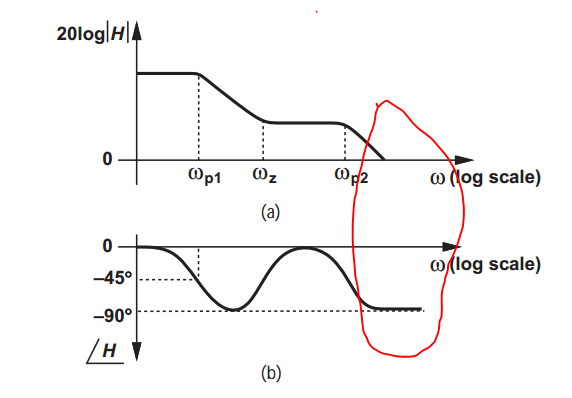
I got the plots as below. However, I want to see the magnitude and phase of that function for frequencies larger than 10^13 Hz (the red region as in the picture).

Could you tell me how to do that? I tried to modify the PlotRange function as below but it doesn't work.

BodePlot[(1 + s/10^6)/((1 + s/10^2)*(1 + s/10^12)), PlotRange -> {{0.1, 10^15}, {-100, 0}}]

enter image description here

enter image description here

$\endgroup$

1 Answer 1

4
$\begingroup$
BodePlot[(1 + s/10^6)/((1 + s/10^2) (1 + s/10^12)), {10, 10^20}]

The second argument should be the frequency range (horizontal axis). If you use PlotRange, that affects the vertical axis, which is not what you want. Refer to the documentation:

?BodePlot

In response to your follow-up request, try these options:

BodePlot[(1 + s/10^6)/((1 + s/10^2) (1 + s/10^12)), {.1, 10^20},
     PlotRange -> {{-150, 50}, {-180, 90}}, Axes -> True, Frame -> False, 
     AxesOrigin -> {{0, 0.1}, {0, 0.1}}]

The thing to understand about the default output of BodePlot is that it plots two graphs, and the vertical scale on each is different; therefore, when supplying plotting options, they must be given as a list.

$\endgroup$
1
  • $\begingroup$ Thank you very much, it works. However, is there a way to make PlotRange works? I tried to make the vertical axis wider range than what the function value but why does it also not work? $\endgroup$
    – emnha
    Commented Sep 17, 2016 at 18:30

Your Answer

By clicking “Post Your Answer”, you agree to our terms of service and acknowledge you have read our privacy policy.

Not the answer you're looking for? Browse other questions tagged or ask your own question.