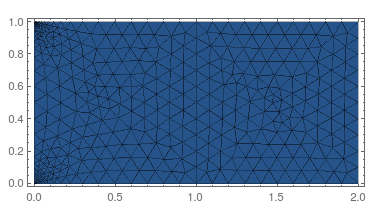
I have a file with mesh points and a value that indicates the domain the point belongs to
https://www.dropbox.com/sh/ll9hb3oxxreufsg/AABvU7nufHhyHY3W4ausanJ6a?dl=0
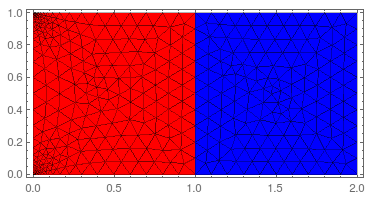
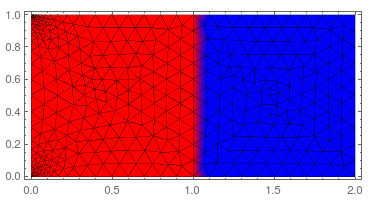
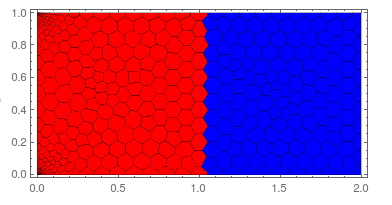
I would like to plot using DensityPlot and showing the mesh in different colors (assuming two domains) according to the domain by using MeshShading
data = Import["https://www.dropbox.com/sh/ll9hb3oxxreufsg/AAA6hJL-suwY6MSslRtuSE7Fa/mesh_and_domain.txt?dl=1", "Table"];

n = Max[data[[;; , 3]]];
domidx = Range[n];
color = {RGBColor[1, 0, 0], RGBColor[0, 0, 1]};
dom = Table[Select[data, #[[3]] == idx &], {idx, domidx}];
Show @@
 {Table[
   ListDensityPlot[dom[[idx]], Mesh -> All, InterpolationOrder -> 1,
    MeshShading -> color[[idx]]], {idx, domidx}],
  PlotRange -> {{0, 2}, {0, 1}}, AspectRatio -> 0.5}
However MeshShading is not accepted as an option for ListDensityPlot
Do you have some idea how to solve it?
Thanks for the suggestions

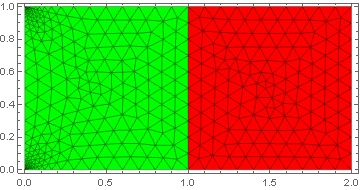
MeshShadingwithMeshStyle? $\endgroup$MeshShadingoption withColorFunction -> (color[[idx]] &)$\endgroup$