added 55 characters in body
Source Link
rhermans
  • 37.4k
  • 4
  • 61
  • 152

You can do it without generating all these variables.

Download data, notice the direct link, easier that way.

data = Import["https://www.dropbox.com/sh/ll9hb3oxxreufsg/AAA6hJL-suwY6MSslRtuSE7Fa/mesh_and_domain.txt?dl=1", "Table"]

Separate using GatherBy[data, Last] (GatherBy).

Change colours using the index of MapIndexed,  to RotateLeft the list {0,0,1} and use as argument for RGBColor

Show[
 MapIndexed[
  ListDensityPlot[#1
    , Mesh -> All
    , InterpolationOrder -> 1
    , ColorFunction -> 
     Function[z, RGBColor[RotateLeft[{0, 0, 1}, Last[#2]]]]
    ] &,
  GatherBy[data, Last]
  ], PlotRange -> {{0, 2}, {0, 1}}, AspectRatio -> 0.5]
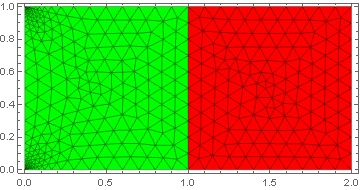
Mathematica graphics

If you have more than three colours, probably you could use Hue[#2/n] (Hue)

You can do it without generating all these variables.

Download data, notice the direct link, easier that way.

data = Import["https://www.dropbox.com/sh/ll9hb3oxxreufsg/AAA6hJL-suwY6MSslRtuSE7Fa/mesh_and_domain.txt?dl=1", "Table"]

Separate using GatherBy[data, Last] (GatherBy).

Change colours using MapIndexed,  RotateLeft and RGBColor

Show[
 MapIndexed[
  ListDensityPlot[#1
    , Mesh -> All
    , InterpolationOrder -> 1
    , ColorFunction -> 
     Function[z, RGBColor[RotateLeft[{0, 0, 1}, Last[#2]]]]
    ] &,
  GatherBy[data, Last]
  ], PlotRange -> {{0, 2}, {0, 1}}, AspectRatio -> 0.5]

Mathematica graphics

If you have more than three colours, probably you could use Hue[#2/n] (Hue)

You can do it without generating all these variables.

Download data, notice the direct link, easier that way.

data = Import["https://www.dropbox.com/sh/ll9hb3oxxreufsg/AAA6hJL-suwY6MSslRtuSE7Fa/mesh_and_domain.txt?dl=1", "Table"]

Separate using GatherBy[data, Last] (GatherBy).

Change colours using the index of MapIndexed,to RotateLeft the list {0,0,1} and use as argument for RGBColor

Show[
 MapIndexed[
  ListDensityPlot[#1
    , Mesh -> All
    , InterpolationOrder -> 1
    , ColorFunction -> 
     Function[z, RGBColor[RotateLeft[{0, 0, 1}, Last[#2]]]]
    ] &,
  GatherBy[data, Last]
  ], PlotRange -> {{0, 2}, {0, 1}}, AspectRatio -> 0.5]

Mathematica graphics

If you have more than three colours, probably you could use Hue[#2/n] (Hue)

added 137 characters in body
Source Link
rhermans
  • 37.4k
  • 4
  • 61
  • 152

You can do it without generating all these variables.

Download data, notice the direct link, easier that way.

data = Import["https://www.dropbox.com/sh/ll9hb3oxxreufsg/AAA6hJL-suwY6MSslRtuSE7Fa/mesh_and_domain.txt?dl=1", "Table"]

Separate using GatherBy[data, Last] (GatherBy).

Change colours using MapIndexed, RotateLeft and RGBColor

Show[
 MapIndexed[
  ListDensityPlot[#1
    , Mesh -> All
    , InterpolationOrder -> 1
    , ColorFunction -> 
     Function[z, RGBColor[RotateLeft[{0, 0, 1}, Last[#2]]]]
    ] &,
  GatherBy[data, Last]
  ], PlotRange -> {{0, 2}, {0, 1}}, AspectRatio -> 0.5]

Mathematica graphics

If you have more than three colours, probably you could use Hue[#2/n] (Hue)

You can do it without generating all these variables.

Download data, notice the direct link, easier that way.

data = Import["https://www.dropbox.com/sh/ll9hb3oxxreufsg/AAA6hJL-suwY6MSslRtuSE7Fa/mesh_and_domain.txt?dl=1", "Table"]

Separate using GatherBy[data, Last] (GatherBy).

Change colours using MapIndexed, RotateLeft and RGBColor

Show[
 MapIndexed[
  ListDensityPlot[#1
    , Mesh -> All
    , InterpolationOrder -> 1
    , ColorFunction -> 
     Function[z, RGBColor[RotateLeft[{0, 0, 1}, Last[#2]]]]
    ] &,
  GatherBy[data, Last]
  ], PlotRange -> {{0, 2}, {0, 1}}, AspectRatio -> 0.5]

Mathematica graphics

If you have more than three colours, probably you could use Hue[#2/n] (Hue)

added 422 characters in body
Source Link
rhermans
  • 37.4k
  • 4
  • 61
  • 152

You can do it without generating all these variables.

Download data, notice the direct link, easier that way.

data = Import["https://www.dropbox.com/sh/ll9hb3oxxreufsg/AAA6hJL-suwY6MSslRtuSE7Fa/mesh_and_domain.txt?dl=1", "Table"]
 

Separate using GatherBy[data, Last] (GatherBy).

Change colours using MapIndexed, RotateLeft and RGBColor

Show[
 MapIndexed[
  ListDensityPlot[#1
    , Mesh -> All
    , InterpolationOrder -> 1
    , ColorFunction -> 
     Function[z, RGBColor[RotateLeft[{0, 0, 1}, Last[#2]]]]
    ] &,
  GatherBy[data, Last]
  ], PlotRange -> {{0, 2}, {0, 1}}, AspectRatio -> 0.5]

Mathematica graphics

data = Import["https://www.dropbox.com/sh/ll9hb3oxxreufsg/AAA6hJL-suwY6MSslRtuSE7Fa/mesh_and_domain.txt?dl=1", "Table"]
 
Show[
 MapIndexed[
  ListDensityPlot[#1
    , Mesh -> All
    , InterpolationOrder -> 1
    , ColorFunction -> 
     Function[z, RGBColor[RotateLeft[{0, 0, 1}, Last[#2]]]]
    ] &,
  GatherBy[data, Last]
  ], PlotRange -> {{0, 2}, {0, 1}}, AspectRatio -> 0.5]

Mathematica graphics

You can do it without generating all these variables.

Download data, notice the direct link, easier that way.

data = Import["https://www.dropbox.com/sh/ll9hb3oxxreufsg/AAA6hJL-suwY6MSslRtuSE7Fa/mesh_and_domain.txt?dl=1", "Table"]

Separate using GatherBy[data, Last] (GatherBy).

Change colours using MapIndexed, RotateLeft and RGBColor

Show[
 MapIndexed[
  ListDensityPlot[#1
    , Mesh -> All
    , InterpolationOrder -> 1
    , ColorFunction -> 
     Function[z, RGBColor[RotateLeft[{0, 0, 1}, Last[#2]]]]
    ] &,
  GatherBy[data, Last]
  ], PlotRange -> {{0, 2}, {0, 1}}, AspectRatio -> 0.5]

Mathematica graphics

added 127 characters in body
Source Link
rhermans
  • 37.4k
  • 4
  • 61
  • 152
Loading
Source Link
rhermans
  • 37.4k
  • 4
  • 61
  • 152
Loading