5
$\begingroup$

I have two contour plots:

c1 = ContourPlot[Cos[x] + Cos[y], {x, 0, 4 Pi}, {y, 0, 4 Pi}, 
  FrameTicks -> None]
c2 = ContourPlot[10*Cos[x] + Cos[y], {x, 0, 4 Pi}, {y, 0, 4 Pi}, 
  FrameTicks -> None]

I want to be able to compare them not only in terms of numbers but also in terms of colors. So same value -> same color.

How can I make sure that the colors between the two contour plots match ? Also, they should have one unique legend.

$\endgroup$

1 Answer 1

4
$\begingroup$

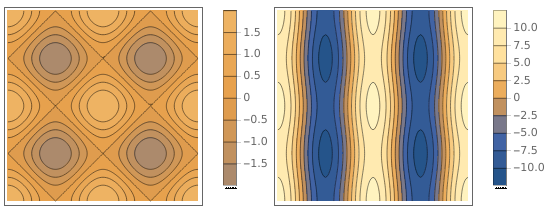
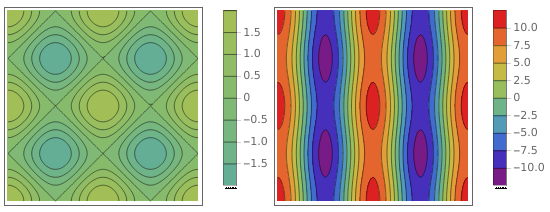
Find the narrowest range that covers the range of both plots and use it as color function range in both plots:

range = MapThread[# @ #2 &, {{Min, Max}, Transpose @
 (Through[{MinValue, MaxValue}[{#, 0 <= x <= 4 Pi,  0 <= y <= 4 Pi}, {x, y}, Reals]] & /@ 
   {Cos[x] + Cos[y], 10 Cos[x] + Cos[y]})}]
{c1, c2} =  ContourPlot[#, {x, 0, 4 Pi}, {y, 0, 4 Pi}, 
  FrameTicks -> None, PlotLegends -> Automatic,ImageSize -> 300,
  ColorFunction -> ColorData[{"Rainbow", range}], ColorFunctionScaling -> False] & /@ 
   {Cos[x] + Cos[y], 10 Cos[x] + Cos[y]};

Row[{c1, c2}]

enter image description here

To use the default color function with the new color range change "Rainbow" above to "M10DefaultDensityGradient" to get:

enter image description here

$\endgroup$
1
  • $\begingroup$ Nice ! Thanks a lot !! $\endgroup$
    – james
    Commented May 31, 2018 at 13:26

Your Answer

By clicking “Post Your Answer”, you agree to our terms of service and acknowledge you have read our privacy policy.

Not the answer you're looking for? Browse other questions tagged or ask your own question.