1
$\begingroup$

I have a function g(x,y) and would like to plot it as g(x) with a slider to vary y. What I currently have is a g(x,y) plotted as g(x) but with y as a parameter which I can adjust:

Manipulate[Plot[g[x,y],{x,0,10}],{y,0,10}]

That works fine, but now I'd like to be able to vary the upper value of the x-axis so that we can adjust how much of the graph we see (or how much of the x-axis we see). This is what I've tried (but didn't work):

Manipulate[Plot[g[x,y],{x,0,Manipulate[x,{x,0.1,10}]}],{y,0,10}]
$\endgroup$

1 Answer 1

4
$\begingroup$

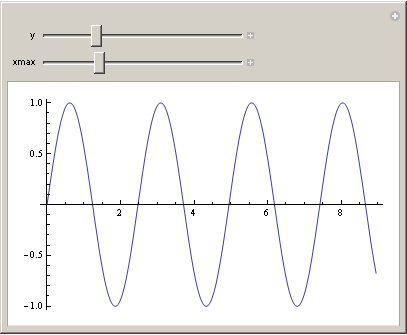
Like this?

g[x_, y_] := Sin[y x] 
Manipulate[Plot[g[x,y],{x,0,xmax}],{y,0,10},{{xmax,10},1,30}]

Mathematica graphics

$\endgroup$
2
  • $\begingroup$ Thanks a lot - what does the 10 in {xmax, 10} do? $\endgroup$
    – tukmajerb
    Commented Mar 26, 2014 at 2:16
  • $\begingroup$ @tukmajerb, it defines the initial value. You should read the documentation, it is really good. Highlight Manipulate and press F1. $\endgroup$
    – rhermans
    Commented Mar 26, 2014 at 7:27

Your Answer

By clicking “Post Your Answer”, you agree to our terms of service and acknowledge you have read our privacy policy.

Not the answer you're looking for? Browse other questions tagged or ask your own question.