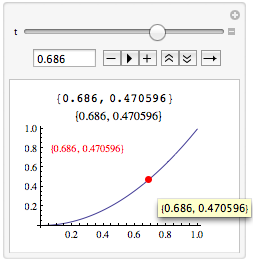
There are many ways to do this, depending on how you want to display the coordinates. The following example displays the coordinates in four ways (other than reading them from the graph itself).
1) The first uses a Text graphics primitive in the Epilog option.
2) The second uses the Tooltip applied to a Point graphics primitive also in the Epilog option. If you hover your mouse over the point, the tooltip will popup displaying the tooltip text (in this case the coordinates).
3) The third uses the PlotLabel option to display the coordinate text.
4) The fourth displays the coordinates outside of the plot altogether in a different cell of a display Grid.
f[x_] := x^2;
Manipulate[Grid[{
 {{t, f[t]}},
 {Plot[f[x], {x, 0, 1},
   Epilog -> {PointSize[Large], Red,
              Tooltip[Point[{t, f[t]}], {t, f[t]}],
              Text[{t, f[t]}, {0.3, 0.8}]},
   PlotLabel -> {t, f[t]}]}
}], {t, 0, 1}]


