6
$\begingroup$

I'm trying to use NDSolve inside manipulate. Specifically, I have a series of differential equations with coefficients, k1, k2, k3, k11, k22, that I'd like to be able to vary. I am currently getting a blank plot. The code I am using is as follows:

Manipulate[
 Plot[revised1[t_] = 
   NDSolve[{y1'[t] == -k1*y1[t]*y2[t] + k11*y3[t], 
     y2'[t] == -k1*y1[t]*y2[t] + k3*y5[t] + k11*y3[t], 
     y3'[t] == 
      k1*y1[t]*y2[t] - k2*y3[t]*y4[t] + k22*y5[t] - k11*y3[t], 
     y4'[t] == -k2*y4[t]*y3[t] + k22*y5[t], 
     y5'[t] == k2*y3[t]*y4[t] - k22*y5[t] - k3*y5[t], 
     y6'[t] == k3*y5[t], y1[0] == 300, y2[0] == 1, y3[0] == 0, 
     y4[0] == 200, y5[0] == 0, y6[0] == 0}, {y1[t], y2[t], y3[t], 
     y4[t], y5[t], y6[t]}, {t, 0, 200}], {t, 0, 200}], {k1, 0, 
     100}, {k11, 0, 100}, {k2, 0, 100}, {k22, 0, 100}, {k3, 0, 100}]

What should I change in order to plot the solutions to the system of differential equations and be able to manipulate the k values?

$\endgroup$
4
  • $\begingroup$ Welcome to Mathematica.SE! I hope you will become a regular contributor. To get started, 1) take the introductory Tour now, 2) when you see good questions and answers, vote them up by clicking the gray triangles, because the credibility of the system is based on the reputation gained by users sharing their knowledge, 3) remember to accept the answer, if any, that solves your problem, by clicking the checkmark sign, and 4) give help too, by answering questions in your areas of expertise. $\endgroup$
    – bbgodfrey
    Commented May 23, 2015 at 13:38
  • $\begingroup$ Have you succeeded in plotting the results without Manipulate and with a particular set of k's? NDSolve returns Rules that need to be converted to regular expressions. You might consider using ParametricNDSolveValue instead. $\endgroup$
    – bbgodfrey
    Commented May 23, 2015 at 13:41
  • $\begingroup$ I can plot the results without Manipulate for a particular set of K's, yes. However, I'm having the issue that changing the K values does not result in a different plot. I'm assuming I have some underlying difficulty with NDSolve... $\endgroup$ Commented May 23, 2015 at 13:43
  • $\begingroup$ You must evaluate the solution inside of the manipulate. I do this all the time, unfortunately I don't have an example on this computer. Name your NDSolve sol. Basically after you solve the equations, and before you change the parameter values, Do a Plot[Evaluate[x[t]/.sol,{t,0,tf}]... I provide an actual solution in a little while. $\endgroup$
    – tarhawk
    Commented May 23, 2015 at 13:48

3 Answers 3

9
$\begingroup$

ParametricNDSolveValue is made for such problems:

sol = ParametricNDSolveValue[{y1'[t] == -k1*y1[t]*y2[t] + k11*y3[t], 
   y2'[t] == -k1*y1[t]*y2[t] + k3*y5[t] + k11*y3[t], 
   y3'[t] == k1*y1[t]*y2[t] - k2*y3[t]*y4[t] + k22*y5[t] - k11*y3[t], 
   y4'[t] == -k2*y4[t]*y3[t] + k22*y5[t], 
   y5'[t] == k2*y3[t]*y4[t] - k22*y5[t] - k3*y5[t], 
   y6'[t] == k3*y5[t], y1[0] == 300, y2[0] == 1, y3[0] == 0, 
   y4[0] == 200, y5[0] == 0, y6[0] == 0}, {y1, y2, y3, y4, y5, 
   y6}, {t, 0, 200}, {k1, k2, k3, k11, k22}]

which can be plotted compactly as

Manipulate[
 Plot[Evaluate[#[t] & /@ sol[k1, k2, k3, k11, k22]], {t, 0, 200}, 
   PlotLegends -> {y1, y2, y3, y4, y5, y6}], 
 {{k1, 1}, 0, 100}, {{k11, 1}, 0, 100}, {{k2, 1}, 0, 100}, 
 {{k22, 1}, 0, 100}, {{k3, 1}, 0, 100}]

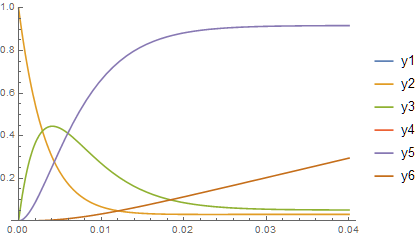
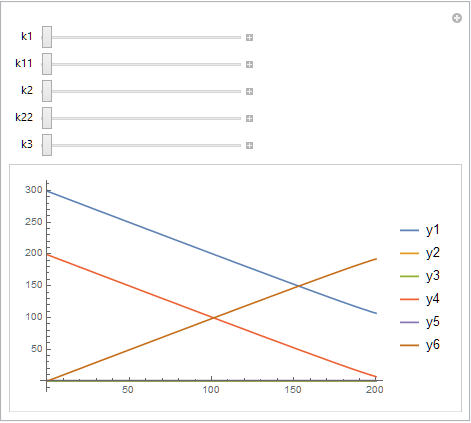
[#[t] & identifies t as the independent variable for all six dependent variables, Evaluate gives the six curves (three of which are relatively small) different colors, and PlotLegend labels them.

enter image description here

Addendum

A blowup of the plot near the origin shows lively action there.

enter image description here

Note that k3 has increased to 10 to show y6 more clearly.

$\endgroup$
5
$\begingroup$

Here's a quick one. It'd be wise to solve the equations for a set of variables k1,...,k22 just once. This is possible with dynamic programming

revised1[k1_, k2_, k3_, k11_, k22_] := 
 revised1[k1, k2, k3, k11, k22] = 
  NDSolve[{y1'[t] == -k1*y1[t]*y2[t] + k11*y3[t], 
    y2'[t] == -k1*y1[t]*y2[t] + k3*y5[t] + k11*y3[t], 
    y3'[t] == k1*y1[t]*y2[t] - k2*y3[t]*y4[t] + k22*y5[t] - k11*y3[t],
     y4'[t] == -k2*y4[t]*y3[t] + k22*y5[t], 
    y5'[t] == k2*y3[t]*y4[t] - k22*y5[t] - k3*y5[t], 
    y6'[t] == k3*y5[t], y1[0] == 300, y2[0] == 1, y3[0] == 0, 
    y4[0] == 200, y5[0] == 0, y6[0] == 0}, {y1, y2, y3, y4, y5, 
    y6}, {t, 0, 200}]

Now it's possible to put it into Manipulate.

Manipulate[
 Plot[({y1[x] /. revised1[k1, k2, k3, k11, k22], 
    y2[x] /. revised1[k1, k2, k3, k11, k22], 
    y3[x] /. revised1[k1, k2, k3, k11, k22], 
    y4[x] /. revised1[k1, k2, k3, k11, k22], 
    y5[x] /. revised1[k1, k2, k3, k11, k22], 
    y6[x] /. revised1[k1, k2, k3, k11, k22]}), {x, 0, 200}, 
  PlotRange -> All, 
  PlotStyle -> {Red, Green, Blue, Yellow, Brown, Black}, 
  PlotRange -> All, PlotLegends -> {y1, y2, y3, y4, y5, y6}], {k1, 0, 
  100, 10}, {k2, 0, 100, 10}, {k3, 0, 100, 10}, {k11, 0, 100, 
  10}, {k22, 0, 100, 10}]

enter image description here

$\endgroup$
6
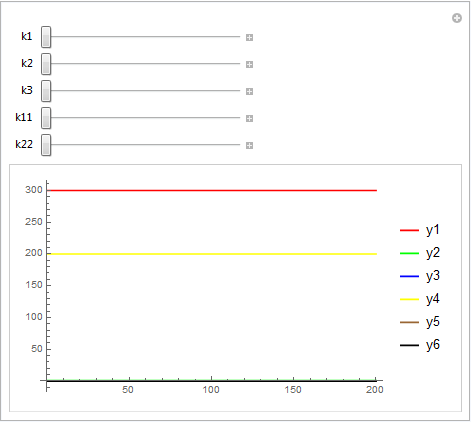
  • $\begingroup$ Thanks! This is what I'm looking to do except I'm still having problems with the plot. I can get it to plot with slide bars to adjust k values but I see no change. This seems to be an issue with either NDSolve or the model rather than manipulate, but I'm not sure what to adjust. $\endgroup$ Commented May 23, 2015 at 14:11
  • $\begingroup$ I've seen the changes of the plot and they are very small. Perhaps one could change the initial conditions for a "better" result (less static one). $\endgroup$ Commented May 23, 2015 at 14:14
  • $\begingroup$ Thanks. I'll try that. Is there an easy way to add manipulation of the initial conditions? $\endgroup$ Commented May 23, 2015 at 14:20
  • $\begingroup$ This would require adding addition variables con1, con2,... in the revised1 function just as I've defined the dependence on k1 and others. $\endgroup$ Commented May 23, 2015 at 14:26
  • $\begingroup$ Awesome. I changed the initial conditions and it looks great. Thanks so much!!! $\endgroup$ Commented May 23, 2015 at 14:27
1
$\begingroup$

Here is a quick example to get you started. You'll have to create a list of values for kA and kB. Just do table from 0.001 to 1.0 for both of them.

kA=Table[i,{i,0.001,1.0,0.001}];
kB=Table[i,{i,0.001,1.0,0.001}];
Manipulate[
{
 eqA = A'[t] == -kA[[i]]*A[t];
 eqB = B'[t] == kA[[i]]*A[t] - kB[[i]]*B[t];
 eqC = c'[t] == kB[[i]]*B[t];
 soln =
  NDSolve[
   {eqA, eqB, eqC,
    A[0] == 35,
    B[0] == 0,
    c[0] == 0
   },
    {A, B, c},
    {t, 0, 100}
  ];
 {
  SpecA = 
   Plot[Evaluate[A[t]] /. soln, {t, 0, 100}, 
    PlotStyle -> {Thick, Red}, PlotRange -> All, ImageSize -> 550];
  SpecB = 
   Plot[Evaluate[B[t]] /. soln, {t, 0, 100}, 
    PlotStyle -> {Thick, Blue}, PlotRange -> All, ImageSize -> 550];
  Show[{SpecA, SpecB}, ImageSize -> 600]
  }
 },
{i, 1, Length[kA], 1}
]
$\endgroup$
2
  • $\begingroup$ Thanks for your help. I'm not sure how to create the list? What does that accomplish? $\endgroup$ Commented May 23, 2015 at 14:13
  • $\begingroup$ See edit, creating the list before hand provides the iterator i in the manipulate list to iterate over. In this case it changes the values of the parameters at the same time. You just as easily, define the values for kB by using j as another iterator to control the kB values kB[[j]]. $\endgroup$
    – tarhawk
    Commented May 23, 2015 at 14:59

Your Answer

By clicking “Post Your Answer”, you agree to our terms of service and acknowledge you have read our privacy policy.

Not the answer you're looking for? Browse other questions tagged or ask your own question.