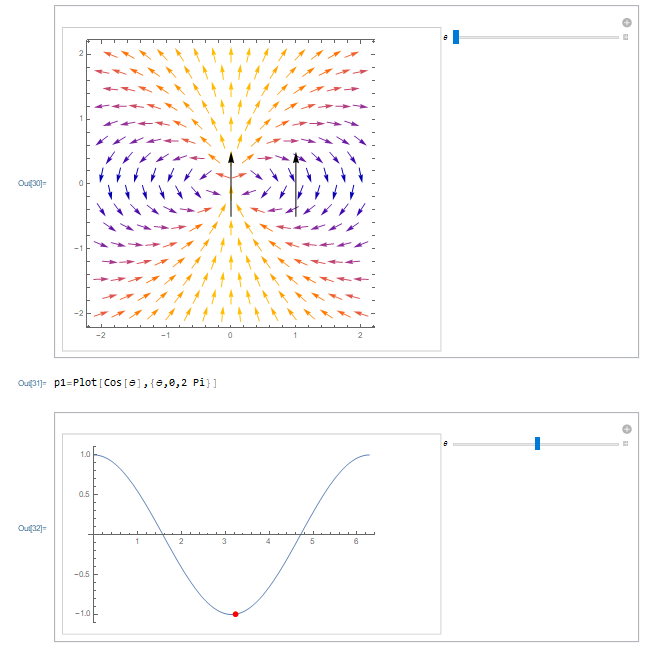
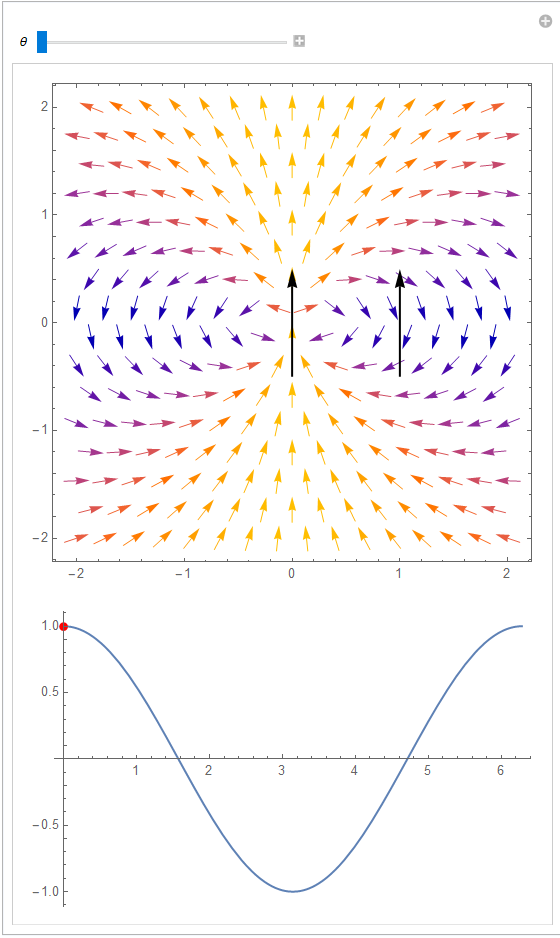
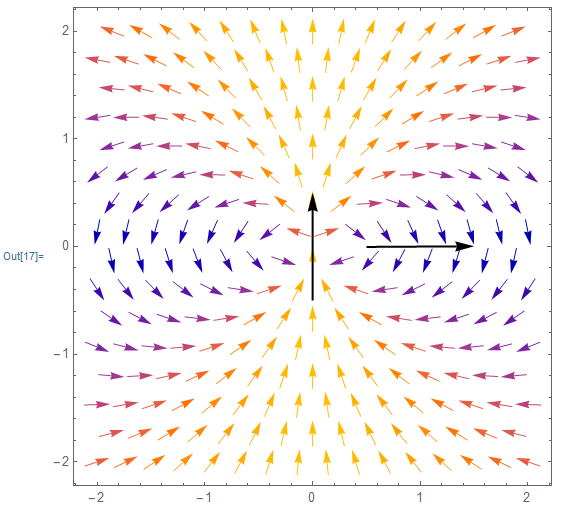
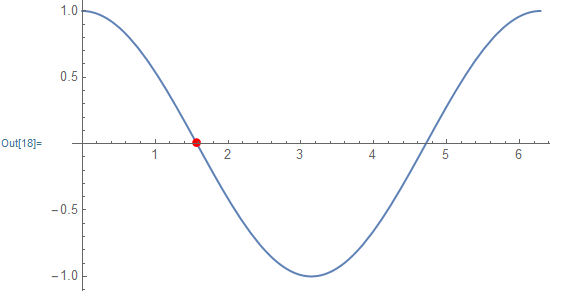
I have two graphics for a visualization that both depend on the same parameter (an angle). I'd like for both graphics to be controlled by the same slider, but I can't have the graphics overlay each other using Show as they need to stay separate. Any idea how to do this?
 "p2=VectorPlot[{(3Cos[ArcTan[x/y]]Sin[ArcTan[x/y]]),(2Cos[ArcTan[x/y]]\
 Cos[ArcTan[x/y]]-Sin[ArcTan[x/y]]Sin[ArcTan[x/y]])},{x,-2,2},{y,-2,2}]"
 Manipulate[Show[
 p2, Graphics[{Thick, Arrow[{{1 - 0.5 Sin[\[Theta]],  0.5 - 0.5 Cos[\[Theta]] - 0.5}, {1 + 0.5 Sin[\[Theta]], 0.5 + 0.5 Cos[\[Theta]] - 0.5}}],Arrow[{{0, -0.5}, {0, 0.5}}]}, Axes -> False]], {\[Theta], 0,
 2 Pi}]
 "p1=Plot[Cos[\[Theta]],{\[Theta],0,2 Pi}]"
 Manipulate[
 Show[p1, Graphics[{PointSize[Large], Red, Point[{\[Theta], Cos[\[Theta]]}]}]], {\[Theta], 0, 2 Pi}]


RoworColumn: e.g.Row[{plot1, plot2}]withinManipulate. $\endgroup${}button above the edit window. It is recommended that you browse the Markdown help $\endgroup$ArcTan[y, x]instead ofArcTan[x/y]; the former is more suitable for the application you seem to have. $\endgroup$