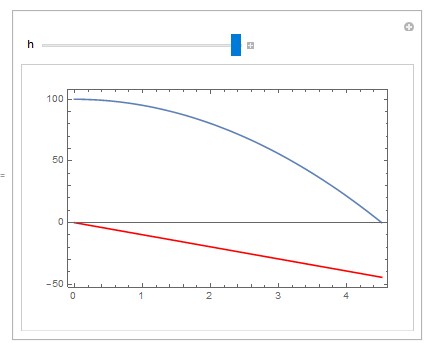
I have two functions which depend on the same parameters and I want to make a manipulate box with both of them, but I want to use one slider to control both function (so I can compare how change in a parameter affects both of them).
The easiest way would be to use Plot command with both of them inside, but they have different y axis so I cannot use it.
For now I use Panel and I have two graphs next to each other, but they have separate sliders with the same parameters.
What is the way out of this?
EXAMPLE
Panel[Manipulate[
   Plot[-9.81*t, {t, 0, Sqrt[2*h/9.81]}, PlotStyle -> Red ], {h , 1,
    100}] Manipulate[
   Plot[h - 9.81*t^2/2, {t, 0, Sqrt[2*h/9.81]}], {h, 1, 100}] ,
 FrameMargins -> 0]


Manipulate[Row@{ Plot[a, {x, 0, 1}, PlotRange -> {0, 10}, ImageSize -> Large], Plot[2 a, {x, 0, 10}, PlotRange -> {0, 10}, ImageSize -> Large] }, {a, 0, 5} ]$\endgroup$@stands forPrefixoperator (search Mathematica help, its powerful ). I'd recommend the following link it gives some useful tips and tricks to jump-start with Mathematica. $\endgroup$