1
$\begingroup$

Original question can be seen in the edit history....

Update

A simpler example - same problem.

i = 
  Table[
    Labeled[{Re[5 Exp[I 5/2 t]], Im[5 Exp[I 5/2 t]]},t, {Right, Top}], 
    {t, 0, 6}]
{Labeled[{5, 0}, 0, {Right, Top}], 
 Labeled[{5*Cos[5/2], 5*Sin[5/2]}, 1, {Right, Top}], 
 Labeled[{5*Cos[5], 5*Sin[5]}, 2, {Right, Top}], 
 Labeled[{5*Cos[15/2], 5*Sin[15/2]}, 3, {Right, Top}], 
 Labeled[{5*Cos[10], 5*Sin[10]}, 4, {Right, Top}], 
 Labeled[{5*Cos[25/2], 5*Sin[25/2]}, 5, {Right, Top}], 
 Labeled[{5*Cos[15], 5*Sin[15]}, 6, {Right, Top}]}
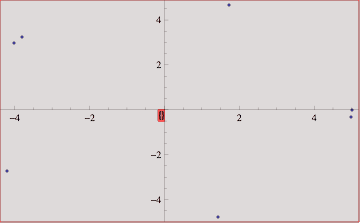
ListPlot[i]
enter image description here

Without PlotMarkers as an option, it will not work.

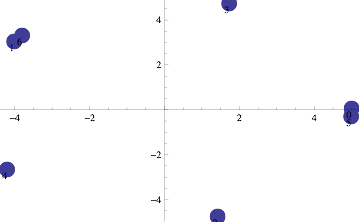
ListPlot[i, PlotMarkers -> {Automatic, Large}]
enter image description here

With PlotMarkers it works but the labels are offset to the reverse of the specified coordinates. Is this not unusual behaviour?

Any suggestions on how to fix this?

I'm running

enter image description here

$\endgroup$
9
  • $\begingroup$ Please do not use [bug] untill it is confirmend. Also, I can't find it so could you tell me why you think ListPlot will accept Labeled coordinates? $\endgroup$
    – Kuba
    Commented Nov 14, 2013 at 12:14
  • $\begingroup$ no labels at all here (version 9.0.1, Mac OS X) $\endgroup$
    – cormullion
    Commented Nov 14, 2013 at 12:58
  • 1
    $\begingroup$ Your example code is so far from a minimum working example that it obscures your problem rather than elucidating it. $\endgroup$
    – m_goldberg
    Commented Nov 14, 2013 at 15:18
  • $\begingroup$ @Kuba. Is there somewhere where I can find out useful hints like "... never say bug ..." - it says nothing about this in the mmaSE help pages. I found the reference to using Labeled within ListPlot here. That answer was upvoted 9 times but it won't evaluate! Also,see update. Thanks. $\endgroup$
    – geordie
    Commented Nov 14, 2013 at 23:44
  • 2
    $\begingroup$ workaround - BubbleChart[i, ChartElementFunction -> ({Disk[Most[#2], .3], White, Text[Last[#2], Most[#2]]} & ), Axes -> True, Frame -> False] :) $\endgroup$
    – cormullion
    Commented Nov 15, 2013 at 9:56

1 Answer 1

3
$\begingroup$

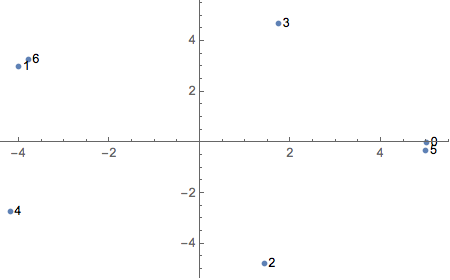
In V.10.4.1, ListPlot works as expected when given the OP's data.

i = 
  Table[Labeled[{Re[5 Exp[I 5/2 t]], Im[5 Exp[I 5/2 t]]}, t, {Right}], {t, 0, 6}];
ListPlot[i]

plot

So what the OP experienced appears to be a bug that has been fixed.

$\endgroup$

Your Answer

By clicking “Post Your Answer”, you agree to our terms of service and acknowledge you have read our privacy policy.

Not the answer you're looking for? Browse other questions tagged or ask your own question.