2
$\begingroup$

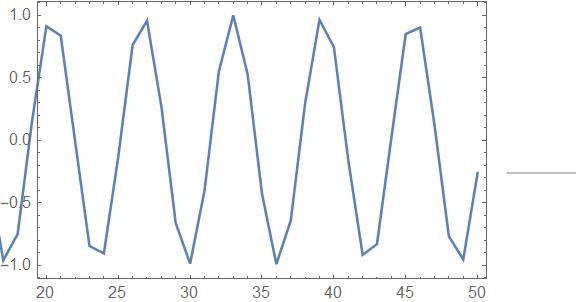
I am having problems with the new labeling functions Labeled when used in ListPlot or any of its sibblings. Labeled data can only be shown with the full range. If I apply a partial PlotRange the plots is messed up:

data = Table[{i, Sin@i}, {i, -50, 50}];

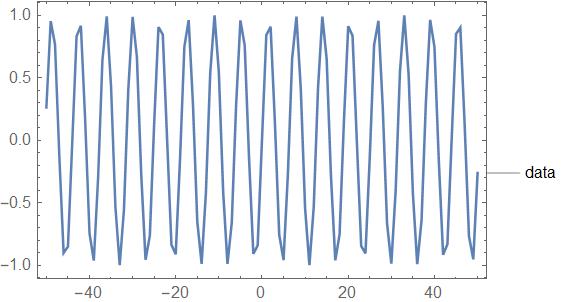
ListLinePlot[Labeled[data, "data"], PlotTheme -> "Frame"]

enter image description here

ListLinePlot[Labeled[data, "data"], PlotRange -> {{20, 50}, All},  PlotTheme -> "Frame"] 

enter image description here

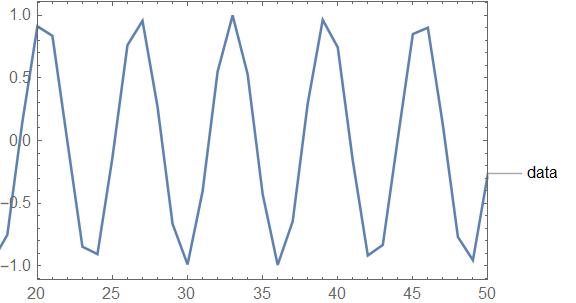
Show doesn't help, as it sometimes does in similar cases. It just adds to the mess:

Show[ListLinePlot[Labeled[data, "data"]], PlotRange -> {{20, 50}, All}]

enter image description here

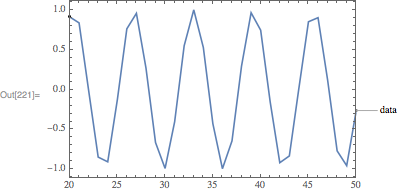
Consistently, the behavior is the same when using Callout instead:

enter image description here

Of course I copuld pre-filter my data, but the whole point of PlotRange is not having to do it. I assume this is a bug. Does anybody know of an easy workaround?

Edit:

This is on Windows 10, Version 11.2

$\endgroup$
6
  • 1
    $\begingroup$ ListLinePlot[Labeled[data, "data", After] ,PlotRange -> {{20, 50}, All}, PlotTheme -> "Frame", ImagePadding->{{Automatic,30}, {Automatic,Automatic }}]? $\endgroup$
    – kglr
    Commented Feb 28, 2018 at 16:01
  • 1
    $\begingroup$ I find it hard not to consider this a bug. Please report to determine if it is the intended behavior. (You can use the give feedback button at the bottom of the docs. $\endgroup$
    – Alan
    Commented Feb 28, 2018 at 17:54
  • $\begingroup$ You should specify the M version, and possibly the OS. On OSX, M11.1 exhibits your issue, while M11.2 does not. $\endgroup$
    – Carl Woll
    Commented Feb 28, 2018 at 18:54
  • $\begingroup$ Btw, perhaps Legended will meet your immediate need. (Works on 11.1.) $\endgroup$
    – Alan
    Commented Feb 28, 2018 at 19:05
  • $\begingroup$ @kglr This is not an improvement. ImagePadding cuts off all the Labels and Ticks. It would be easier to just omit the Labeled. $\endgroup$ Commented Feb 28, 2018 at 19:34

2 Answers 2

2
$\begingroup$

The main problem with restricting the plot range, while having labels that exist outside of the plot range is that the option PlotRangeClipping is not smart enough to clip only the data and not the labels. As a workaround, one can use the Mesh options of ListLinePlot to hide the portion of the plot that shouldn't be seen. This way we don't need to use PlotRangeClipping->True to restrict the plot. Here's an example:

ListLinePlot[
    {Labeled[data, "data"]},
    PlotTheme -> "Frame",
    PlotRange -> {{20, 50}, All},
    Mesh -> {{{20}, {50}}, {}},
    MeshShading -> {None, Opacity[1]}
]

enter image description here

$\endgroup$
1
  • $\begingroup$ Cool. That works. Tank you! $\endgroup$ Commented Mar 1, 2018 at 10:29
2
$\begingroup$

My experience with Mathematica tells me to solve the problem by trimming the data before plotting it, rather than plotting all the data but then restricting the viewport. One way to do it is

data = Table[{i, Sin @ i}, {i, -50, 50}];
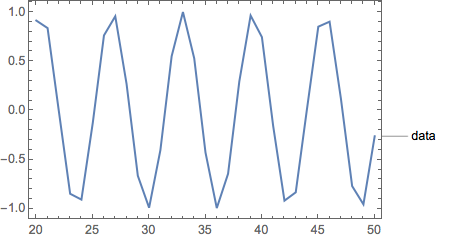
ListLinePlot[Labeled[Select[data, 20 <= First[#] <= 50 &], "data"], PlotTheme -> "Frame"]

But it might even be easier to just generate a new data set.

trimedData = Table[{i, Sin @ i}, {i, 20, 50}];
ListLinePlot[Labeled[trimedData, "data"], PlotTheme -> "Frame"]

Both plots are same.

plot

$\endgroup$
1
  • $\begingroup$ Thanks for answering. Yes, I am aware that pre-filtering is a solution. The point is that I don't want to if I can avoid it. But of course I will do it if no other way shows up. $\endgroup$ Commented Feb 28, 2018 at 19:38

Your Answer

By clicking “Post Your Answer”, you agree to our terms of service and acknowledge you have read our privacy policy.

Not the answer you're looking for? Browse other questions tagged or ask your own question.